29
/
en
AIzaSyAYiBZKx7MnpbEhh9jyipgxe19OcubqV5w
April 1, 2024
209028
New Zealand
NZL
true
2
1
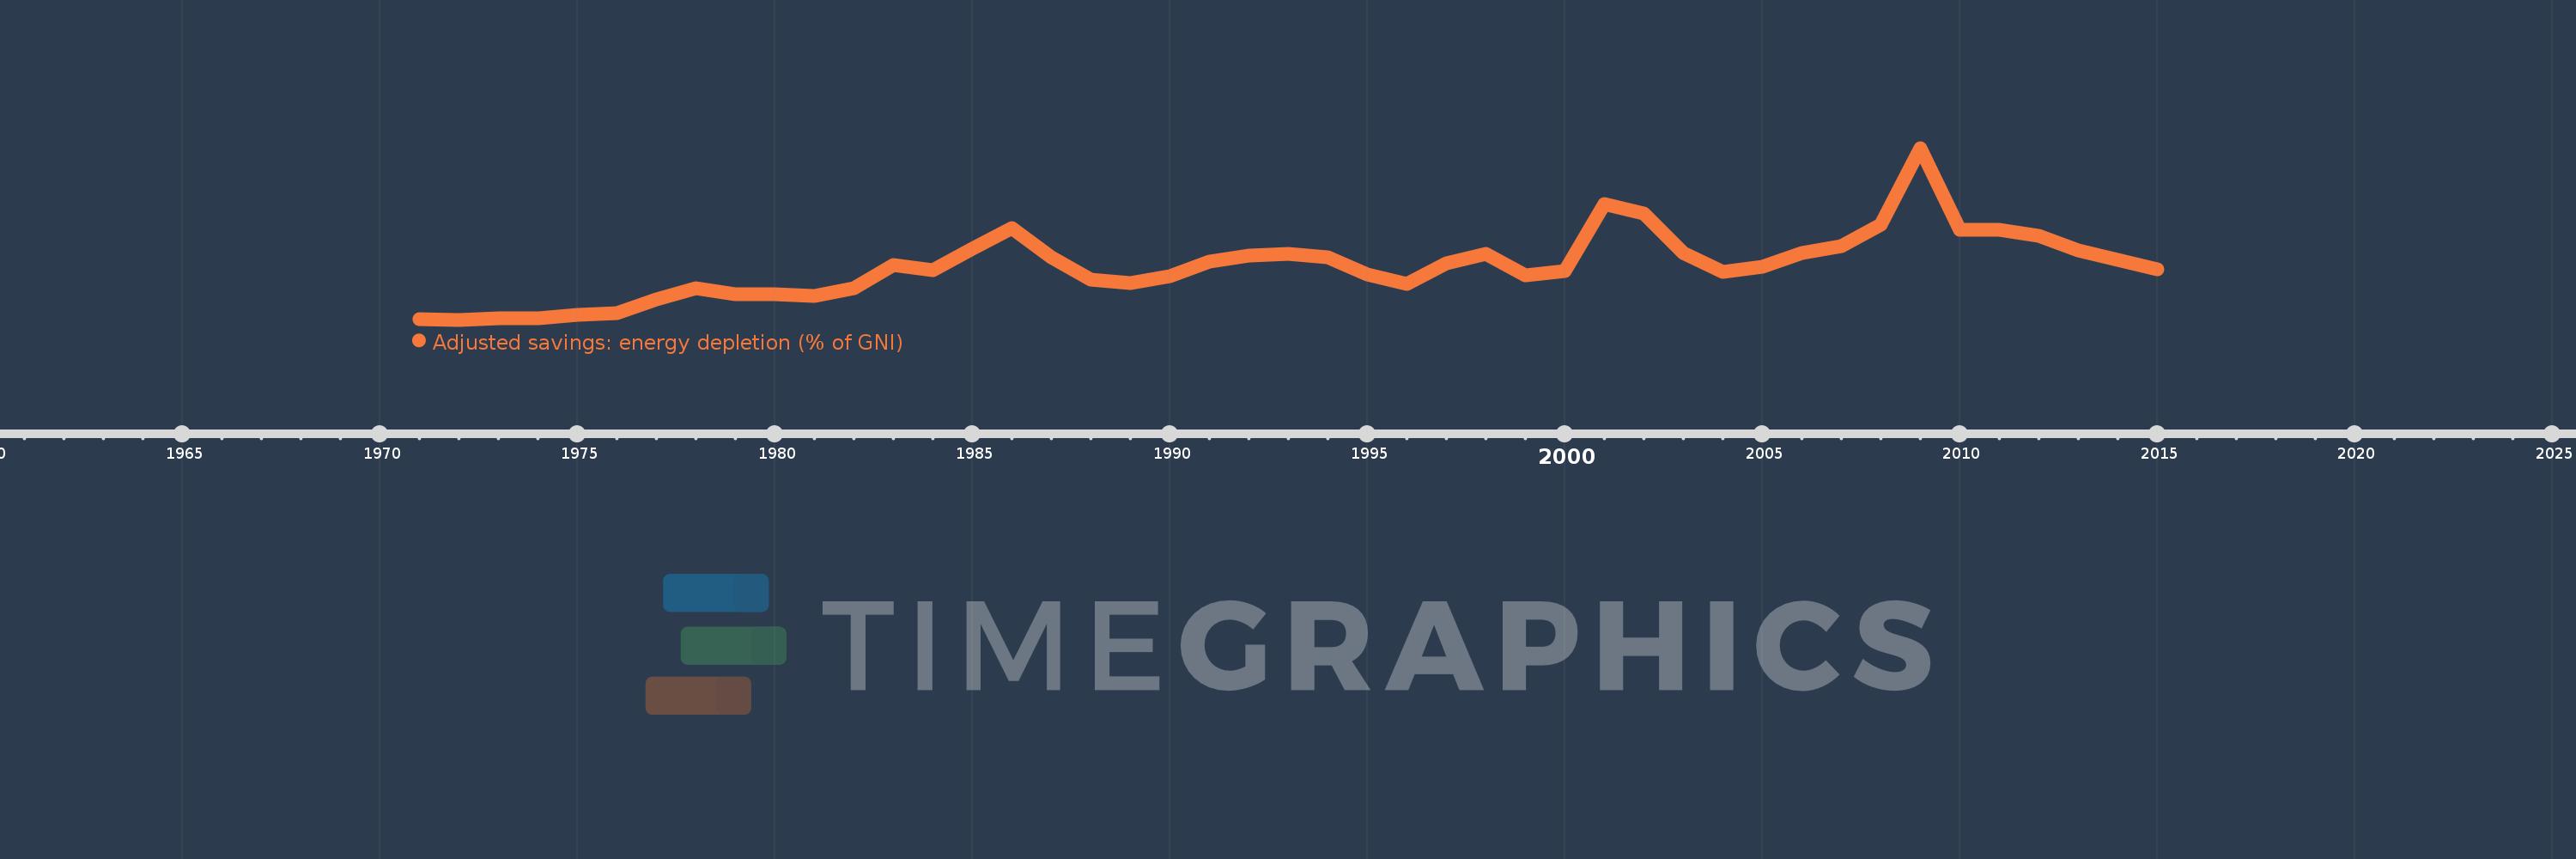
Adjusted savings: energy depletion (% of GNI)
2015,2014,2013,2012,2011,2010,2009,2008,2007,2006,2005,2004,2003,2002,2001,2000,1999,1998,1997,1996,1995,1994,1993,1992,1991,1990,1989,1988,1987,1986,1985,1984,1983,1982,1981,1980,1979,1978,1977,1976,1975,1974,1973,1972,1971
This statistics in other country:
AfghanistanAlbaniaAlgeriaAmerican SamoaAndorraAngolaAntigua and BarbudaArab WorldArgentinaArmeniaAustraliaAustriaAzerbaijanBahamas, TheBahrainBangladeshBarbadosBelarusBelgiumBelizeBeninBermudaBhutanBoliviaBosnia and HerzegovinaBotswanaBrazilBrunei DarussalamBulgariaBurkina FasoBurundiCabo VerdeCambodiaCameroonCanadaCaribbean small statesCentral African RepublicCentral Europe and the BalticsChadChannel IslandsChileChinaColombiaComorosCongo, Dem. Rep.Congo, Rep.Costa RicaCote d'IvoireCroatiaCubaCyprusCzech RepublicDenmarkDjiboutiDominicaDominican RepublicEarly-demographic dividendEast Asia & PacificEast Asia & Pacific (excluding high income)East Asia & Pacific (IDA & IBRD countries)EcuadorEgypt, Arab Rep.El SalvadorEquatorial GuineaEritreaEstoniaEthiopiaEuro areaEurope & Central AsiaEurope & Central Asia (excluding high income)Europe & Central Asia (IDA & IBRD countries)European UnionFaroe IslandsFijiFinlandFragile and conflict affected situationsFranceFrench PolynesiaGabonGambia, TheGeorgiaGermanyGhanaGreeceGreenlandGrenadaGuatemalaGuineaGuinea-BissauGuyanaHaitiHeavily indebted poor countries (HIPC)High incomeHondurasHong Kong SAR, ChinaHungaryIBRD onlyIcelandIDA & IBRD totalIDA blendIDA onlyIDA totalIndiaIndonesiaIran, Islamic Rep.IraqIrelandIsle of ManIsraelItalyJamaicaJapanJordanKazakhstanKenyaKiribatiKorea, Rep.KosovoKuwaitKyrgyz RepublicLao PDRLate-demographic dividendLatin America & Caribbean Latin America & Caribbean (excluding high income)Latin America & the Caribbean (IDA & IBRD countries)LatviaLeast developed countries: UN classificationLebanonLesothoLiberiaLibyaLiechtensteinLithuaniaLow & middle incomeLow incomeLower middle incomeLuxembourgMacao SAR, ChinaMacedonia, FYRMadagascarMalawiMalaysiaMaldivesMaliMaltaMarshall IslandsMauritaniaMauritiusMexicoMicronesia, Fed. Sts.Middle East & North AfricaMiddle East & North Africa (excluding high income)Middle East & North Africa (IDA & IBRD countries)Middle incomeMoldovaMonacoMongoliaMontenegroMoroccoMozambiqueMyanmarNamibiaNepalNetherlandsNew CaledoniaNew ZealandNicaraguaNigerNigeriaNorth AmericaNorwayOECD membersOmanOther small statesPacific island small statesPakistanPalauPanamaPapua New GuineaParaguayPeruPhilippinesPolandPortugalPost-demographic dividendPre-demographic dividendPuerto RicoQatarRomaniaRussian FederationRwandaSamoaSan MarinoSao Tome and PrincipeSaudi ArabiaSenegalSerbiaSeychellesSierra LeoneSingaporeSlovak RepublicSloveniaSmall statesSolomon IslandsSomaliaSouth AfricaSouth AsiaSouth Asia (IDA & IBRD)South SudanSpainSri LankaSt. Kitts and NevisSt. LuciaSt. Vincent and the GrenadinesSub-Saharan Africa Sub-Saharan Africa (excluding high income)Sub-Saharan Africa (IDA & IBRD countries)SudanSurinameSwazilandSwedenSwitzerlandSyrian Arab RepublicTajikistanTanzaniaThailandTimor-LesteTogoTongaTrinidad and TobagoTunisiaTurkeyTurkmenistanTuvaluUgandaUkraineUnited Arab EmiratesUnited KingdomUnited StatesUpper middle incomeUruguayUzbekistanVanuatuVenezuela, RBVietnamVirgin Islands (U.S.)West Bank and GazaWorldYemen, Rep.ZambiaZimbabwe Timeline:
This timeline shows a graph from 1971 to 2015 of New Zealand. No data until 1970. Number of actual observations by date: 45.
Source name:
World Development Indicators
Source organization:
World Bank staff estimates based on sources and methods in World Bank's "The Changing Wealth of Nations: Measuring Sustainable Development in the New Millennium" (2011).
Categories, topics:
Economy & Growth, Energy & Mining, Environment
Last updated:
apr 23, 2017
Indicators value changes by year
At the date of observation
Value
Absolute change
Change from previous value
jan 1, 1971
0.011
+0.011
0.0%
jan 1, 1972
0.008
-0.002
-21.82%
jan 1, 1973
0.025
+0.017
199.08%
jan 1, 1974
0.029
+0.004
17.28%
jan 1, 1975
0.086
+0.056
193.25%
jan 1, 1976
0.111
+0.025
29.58%
jan 1, 1977
0.304
+0.193
173.87%
jan 1, 1978
0.478
+0.175
57.48%
jan 1, 1979
0.387
-0.092
-19.18%
jan 1, 1980
0.38
-0.007
-1.72%
jan 1, 1981
0.36
-0.02
-5.28%
jan 1, 1982
0.469
+0.109
30.3%
jan 1, 1983
0.814
+0.345
73.58%
jan 1, 1984
0.739
-0.075
-9.24%
jan 1, 1985
1.056
+0.317
42.96%
jan 1, 1986
1.362
+0.306
28.96%
jan 1, 1987
0.929
-0.433
-31.8%
jan 1, 1988
0.6
-0.329
-35.39%
jan 1, 1989
0.553
-0.047
-7.91%
jan 1, 1990
0.653
+0.1
18.17%
jan 1, 1991
0.872
+0.219
33.5%
jan 1, 1992
0.958
+0.086
9.88%
jan 1, 1993
0.98
+0.021
2.24%
jan 1, 1994
0.93
-0.049
-5.04%
jan 1, 1995
0.676
-0.254
-27.29%
jan 1, 1996
0.541
-0.136
-20.06%
jan 1, 1997
0.842
+0.301
55.66%
jan 1, 1998
0.981
+0.139
16.52%
jan 1, 1999
0.662
-0.318
-32.46%
jan 1, 2000
0.732
+0.07
10.55%
jan 1, 2001
1.71
+0.977
133.44%
jan 1, 2002
1.582
-0.128
-7.47%
jan 1, 2003
0.99
-0.591
-37.39%
jan 1, 2004
0.71
-0.28
-28.28%
jan 1, 2005
0.785
+0.074
10.48%
jan 1, 2006
0.995
+0.21
26.75%
jan 1, 2007
1.1
+0.106
10.63%
jan 1, 2008
1.412
+0.312
28.32%
jan 1, 2009
2.544
+1.132
80.17%
jan 1, 2010
1.34
-1.204
-47.33%
jan 1, 2011
1.341
+0.001
0.1%
jan 1, 2012
1.243
-0.098
-7.29%
jan 1, 2013
1.035
-0.208
-16.71%
jan 1, 2014
0.898
-0.138
-13.32%
jan 1, 2015
0.747
-0.15
-16.75%
Ranking of countries by current statistics by years


Comments: