29
/
en
AIzaSyAYiBZKx7MnpbEhh9jyipgxe19OcubqV5w
April 1, 2024
109271
Congo, Dem. Rep.
COD
true
2
1
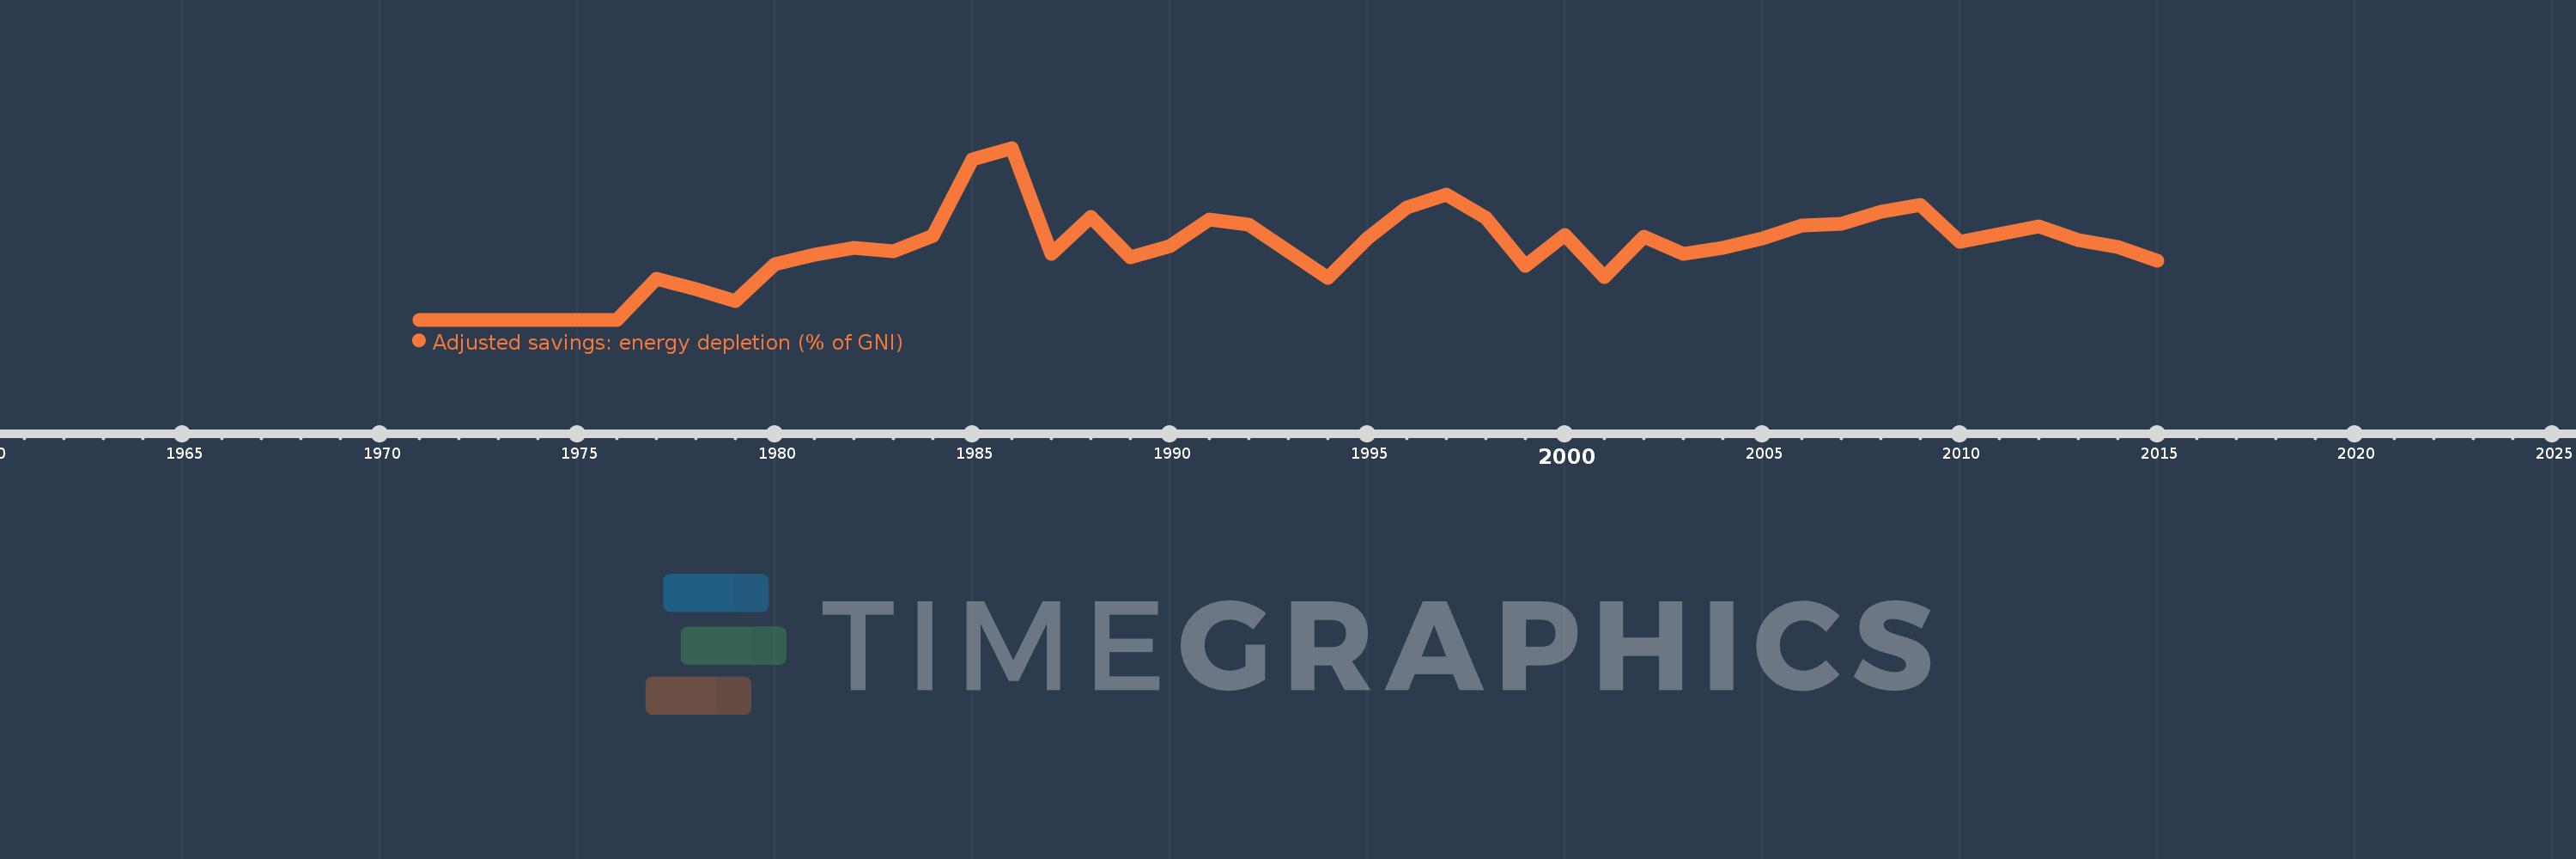
Adjusted savings: energy depletion (% of GNI)
2015,2014,2013,2012,2011,2010,2009,2008,2007,2006,2005,2004,2003,2002,2001,2000,1999,1998,1997,1996,1995,1994,1993,1992,1991,1990,1989,1988,1987,1986,1985,1984,1983,1982,1981,1980,1979,1978,1977,1976,1975,1974,1973,1972,1971
This statistics in other country:
AfghanistanAlbaniaAlgeriaAmerican SamoaAndorraAngolaAntigua and BarbudaArab WorldArgentinaArmeniaAustraliaAustriaAzerbaijanBahamas, TheBahrainBangladeshBarbadosBelarusBelgiumBelizeBeninBermudaBhutanBoliviaBosnia and HerzegovinaBotswanaBrazilBrunei DarussalamBulgariaBurkina FasoBurundiCabo VerdeCambodiaCameroonCanadaCaribbean small statesCentral African RepublicCentral Europe and the BalticsChadChannel IslandsChileChinaColombiaComorosCongo, Dem. Rep.Congo, Rep.Costa RicaCote d'IvoireCroatiaCubaCyprusCzech RepublicDenmarkDjiboutiDominicaDominican RepublicEarly-demographic dividendEast Asia & PacificEast Asia & Pacific (excluding high income)East Asia & Pacific (IDA & IBRD countries)EcuadorEgypt, Arab Rep.El SalvadorEquatorial GuineaEritreaEstoniaEthiopiaEuro areaEurope & Central AsiaEurope & Central Asia (excluding high income)Europe & Central Asia (IDA & IBRD countries)European UnionFaroe IslandsFijiFinlandFragile and conflict affected situationsFranceFrench PolynesiaGabonGambia, TheGeorgiaGermanyGhanaGreeceGreenlandGrenadaGuatemalaGuineaGuinea-BissauGuyanaHaitiHeavily indebted poor countries (HIPC)High incomeHondurasHong Kong SAR, ChinaHungaryIBRD onlyIcelandIDA & IBRD totalIDA blendIDA onlyIDA totalIndiaIndonesiaIran, Islamic Rep.IraqIrelandIsle of ManIsraelItalyJamaicaJapanJordanKazakhstanKenyaKiribatiKorea, Rep.KosovoKuwaitKyrgyz RepublicLao PDRLate-demographic dividendLatin America & Caribbean Latin America & Caribbean (excluding high income)Latin America & the Caribbean (IDA & IBRD countries)LatviaLeast developed countries: UN classificationLebanonLesothoLiberiaLibyaLiechtensteinLithuaniaLow & middle incomeLow incomeLower middle incomeLuxembourgMacao SAR, ChinaMacedonia, FYRMadagascarMalawiMalaysiaMaldivesMaliMaltaMarshall IslandsMauritaniaMauritiusMexicoMicronesia, Fed. Sts.Middle East & North AfricaMiddle East & North Africa (excluding high income)Middle East & North Africa (IDA & IBRD countries)Middle incomeMoldovaMonacoMongoliaMontenegroMoroccoMozambiqueMyanmarNamibiaNepalNetherlandsNew CaledoniaNew ZealandNicaraguaNigerNigeriaNorth AmericaNorwayOECD membersOmanOther small statesPacific island small statesPakistanPalauPanamaPapua New GuineaParaguayPeruPhilippinesPolandPortugalPost-demographic dividendPre-demographic dividendPuerto RicoQatarRomaniaRussian FederationRwandaSamoaSan MarinoSao Tome and PrincipeSaudi ArabiaSenegalSerbiaSeychellesSierra LeoneSingaporeSlovak RepublicSloveniaSmall statesSolomon IslandsSomaliaSouth AfricaSouth AsiaSouth Asia (IDA & IBRD)South SudanSpainSri LankaSt. Kitts and NevisSt. LuciaSt. Vincent and the GrenadinesSub-Saharan Africa Sub-Saharan Africa (excluding high income)Sub-Saharan Africa (IDA & IBRD countries)SudanSurinameSwazilandSwedenSwitzerlandSyrian Arab RepublicTajikistanTanzaniaThailandTimor-LesteTogoTongaTrinidad and TobagoTunisiaTurkeyTurkmenistanTuvaluUgandaUkraineUnited Arab EmiratesUnited KingdomUnited StatesUpper middle incomeUruguayUzbekistanVanuatuVenezuela, RBVietnamVirgin Islands (U.S.)West Bank and GazaWorldYemen, Rep.ZambiaZimbabwe Timeline:
This timeline shows a graph from 1971 to 2015 of Congo, Dem. Rep.. No data until 1970. Number of actual observations by date: 45.
Source name:
World Development Indicators
Source organization:
World Bank staff estimates based on sources and methods in World Bank's "The Changing Wealth of Nations: Measuring Sustainable Development in the New Millennium" (2011).
Categories, topics:
Economy & Growth, Energy & Mining, Environment
Last updated:
apr 23, 2017
Indicators value changes by year
At the date of observation
Value
Absolute change
Change from previous value
jan 1, 1976
0.001
+0.001
%
jan 1, 1977
0.834
+0.833
86.57K%
jan 1, 1978
0.626
-0.208
-24.92%
jan 1, 1979
0.377
-0.249
-39.79%
jan 1, 1980
1.129
+0.752
199.33%
jan 1, 1981
1.316
+0.187
16.52%
jan 1, 1982
1.462
+0.146
11.11%
jan 1, 1983
1.383
-0.078
-5.37%
jan 1, 1984
1.706
+0.323
23.35%
jan 1, 1985
3.268
+1.562
91.57%
jan 1, 1986
3.492
+0.224
6.85%
jan 1, 1987
1.334
-2.158
-61.81%
jan 1, 1988
2.094
+0.76
56.98%
jan 1, 1989
1.276
-0.817
-39.03%
jan 1, 1990
1.49
+0.213
16.71%
jan 1, 1991
2.044
+0.555
37.23%
jan 1, 1992
1.937
-0.108
-5.27%
jan 1, 1993
1.394
-0.542
-28.0%
jan 1, 1994
0.853
-0.541
-38.81%
jan 1, 1995
1.654
+0.801
93.86%
jan 1, 1996
2.286
+0.632
38.24%
jan 1, 1997
2.546
+0.26
11.36%
jan 1, 1998
2.076
-0.47
-18.47%
jan 1, 1999
1.103
-0.973
-46.85%
jan 1, 2000
1.717
+0.614
55.6%
jan 1, 2001
0.866
-0.851
-49.55%
jan 1, 2002
1.684
+0.818
94.44%
jan 1, 2003
1.338
-0.347
-20.58%
jan 1, 2004
1.469
+0.131
9.79%
jan 1, 2005
1.647
+0.178
12.13%
jan 1, 2006
1.914
+0.267
16.2%
jan 1, 2007
1.947
+0.033
1.72%
jan 1, 2008
2.199
+0.253
12.97%
jan 1, 2009
2.341
+0.142
6.47%
jan 1, 2010
1.576
-0.766
-32.7%
jan 1, 2011
1.735
+0.16
10.12%
jan 1, 2012
1.906
+0.171
9.85%
jan 1, 2013
1.618
-0.288
-15.1%
jan 1, 2014
1.472
-0.147
-9.08%
jan 1, 2015
1.202
-0.27
-18.35%
Ranking of countries by current statistics by years


Comments: