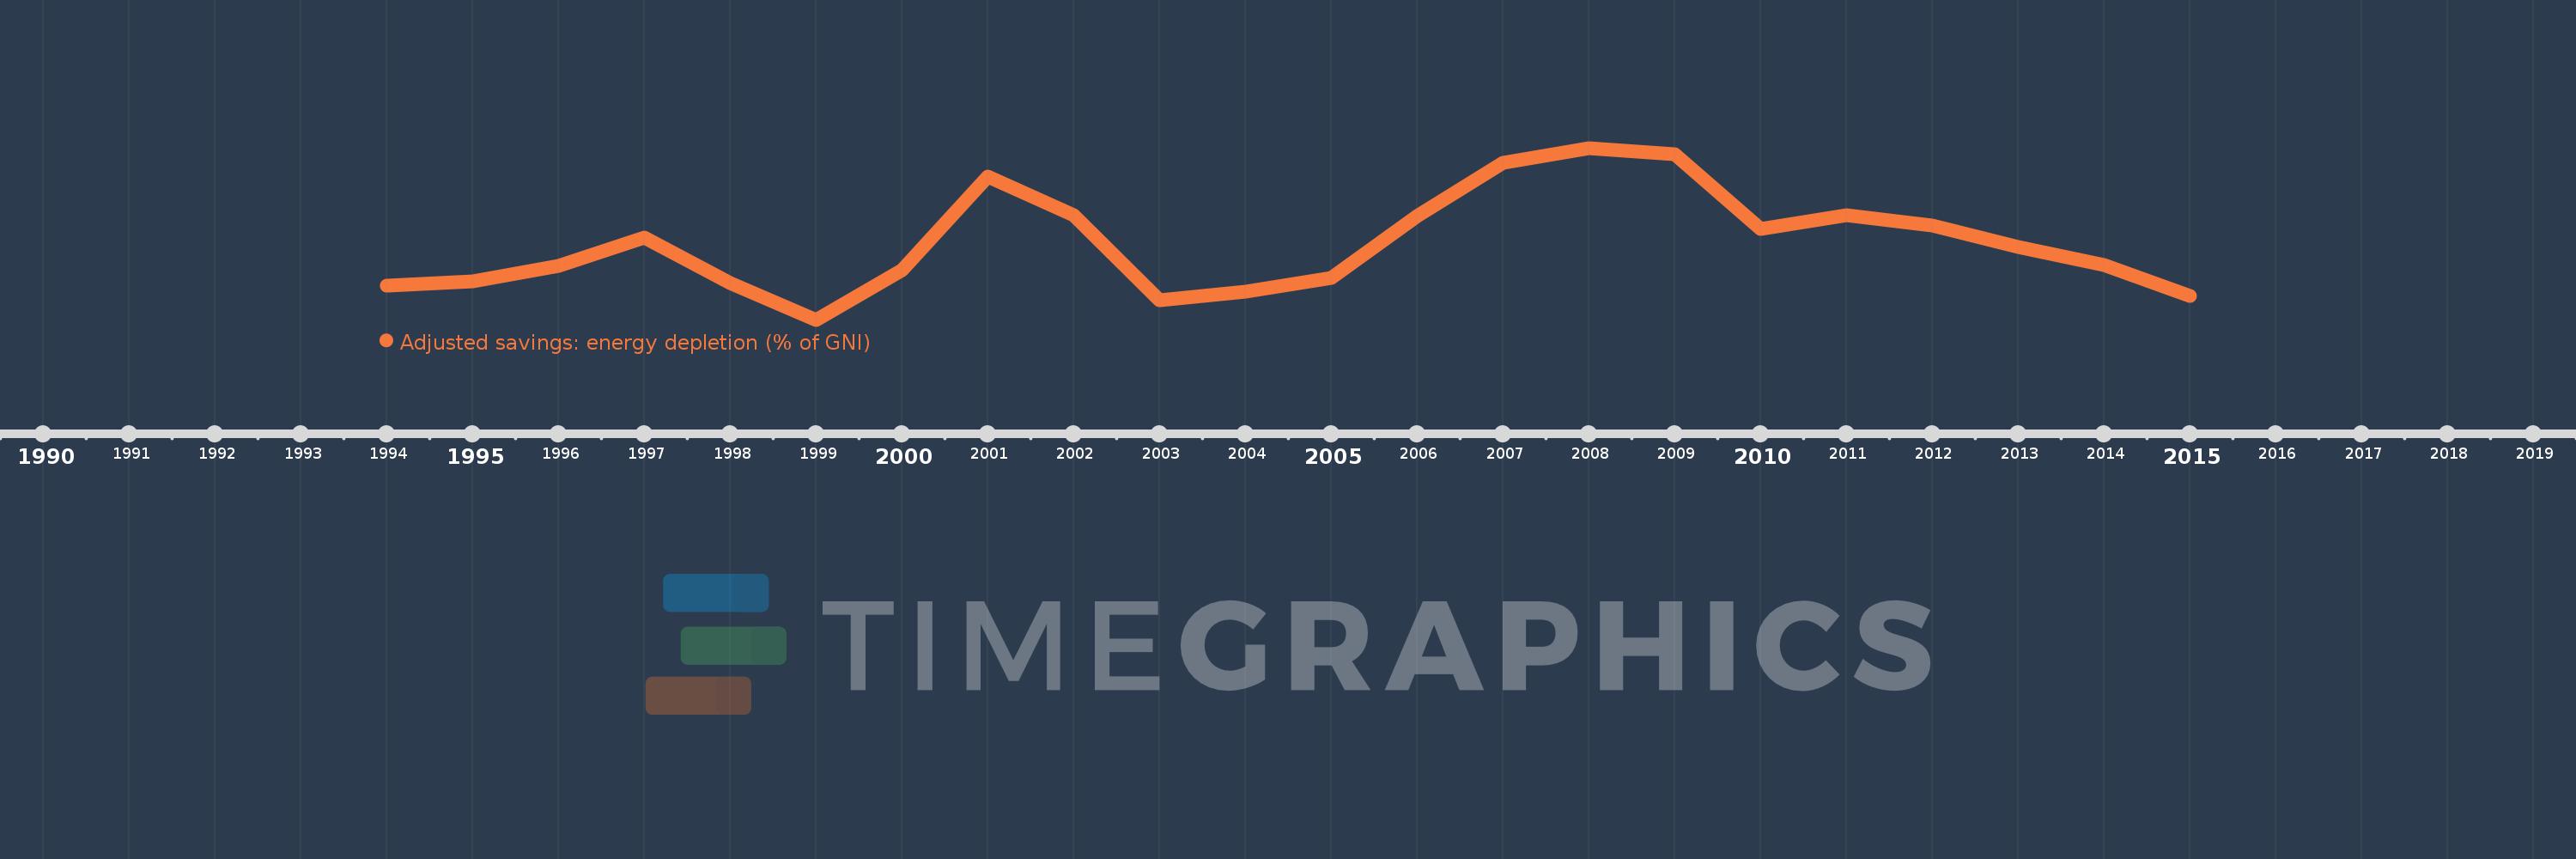
This timeline shows a graph from 1994 to 2015 of Azerbaijan. No data until 1993. Number of actual observations by date: 22.
Source name:
World Development Indicators
Source organization:
World Bank staff estimates based on sources and methods in World Bank's "The Changing Wealth of Nations: Measuring Sustainable Development in the New Millennium" (2011).
Categories, topics:
Economy & Growth, Energy & Mining, Environment
Last updated:
apr 23, 2017
Indicators value changes by year
Meaning:
29.93
Minimum:
14.9
jan 1, 1999
Maximum:
48.9
jan 1, 2008
At the date of observation
Value
Absolute change
Change from the previous value
jan 1, 1994
21.711
+21.711
0.0%
jan 1, 1995
22.481
+0.771
3.55%
jan 1, 1996
25.505
+3.024
13.45%
jan 1, 1997
31.128
+5.623
22.04%
jan 1, 1998
22.244
-8.884
-28.54%
jan 1, 1999
14.9
-7.345
-33.02%
jan 1, 2000
24.755
+9.855
66.14%
jan 1, 2001
43.286
+18.531
74.86%
jan 1, 2002
35.561
-7.726
-17.85%
jan 1, 2003
18.758
-16.803
-47.25%
jan 1, 2004
20.45
+1.693
9.02%
jan 1, 2005
23.106
+2.656
12.99%
jan 1, 2006
35.432
+12.326
53.34%
jan 1, 2007
45.893
+10.461
29.52%
jan 1, 2008
48.9
+3.007
6.55%
jan 1, 2009
47.732
-1.168
-2.39%
jan 1, 2010
32.93
-14.803
-31.01%
jan 1, 2011
35.635
+2.705
8.21%
jan 1, 2012
33.482
-2.153
-6.04%
jan 1, 2013
29.351
-4.131
-12.34%
jan 1, 2014
25.672
-3.678
-12.53%
jan 1, 2015
19.558
-6.115
-23.82%
Ranking of countries by current statistics by years
