29
/
en
AIzaSyAYiBZKx7MnpbEhh9jyipgxe19OcubqV5w
April 1, 2024
234357
Saudi Arabia
SAU
true
2
1
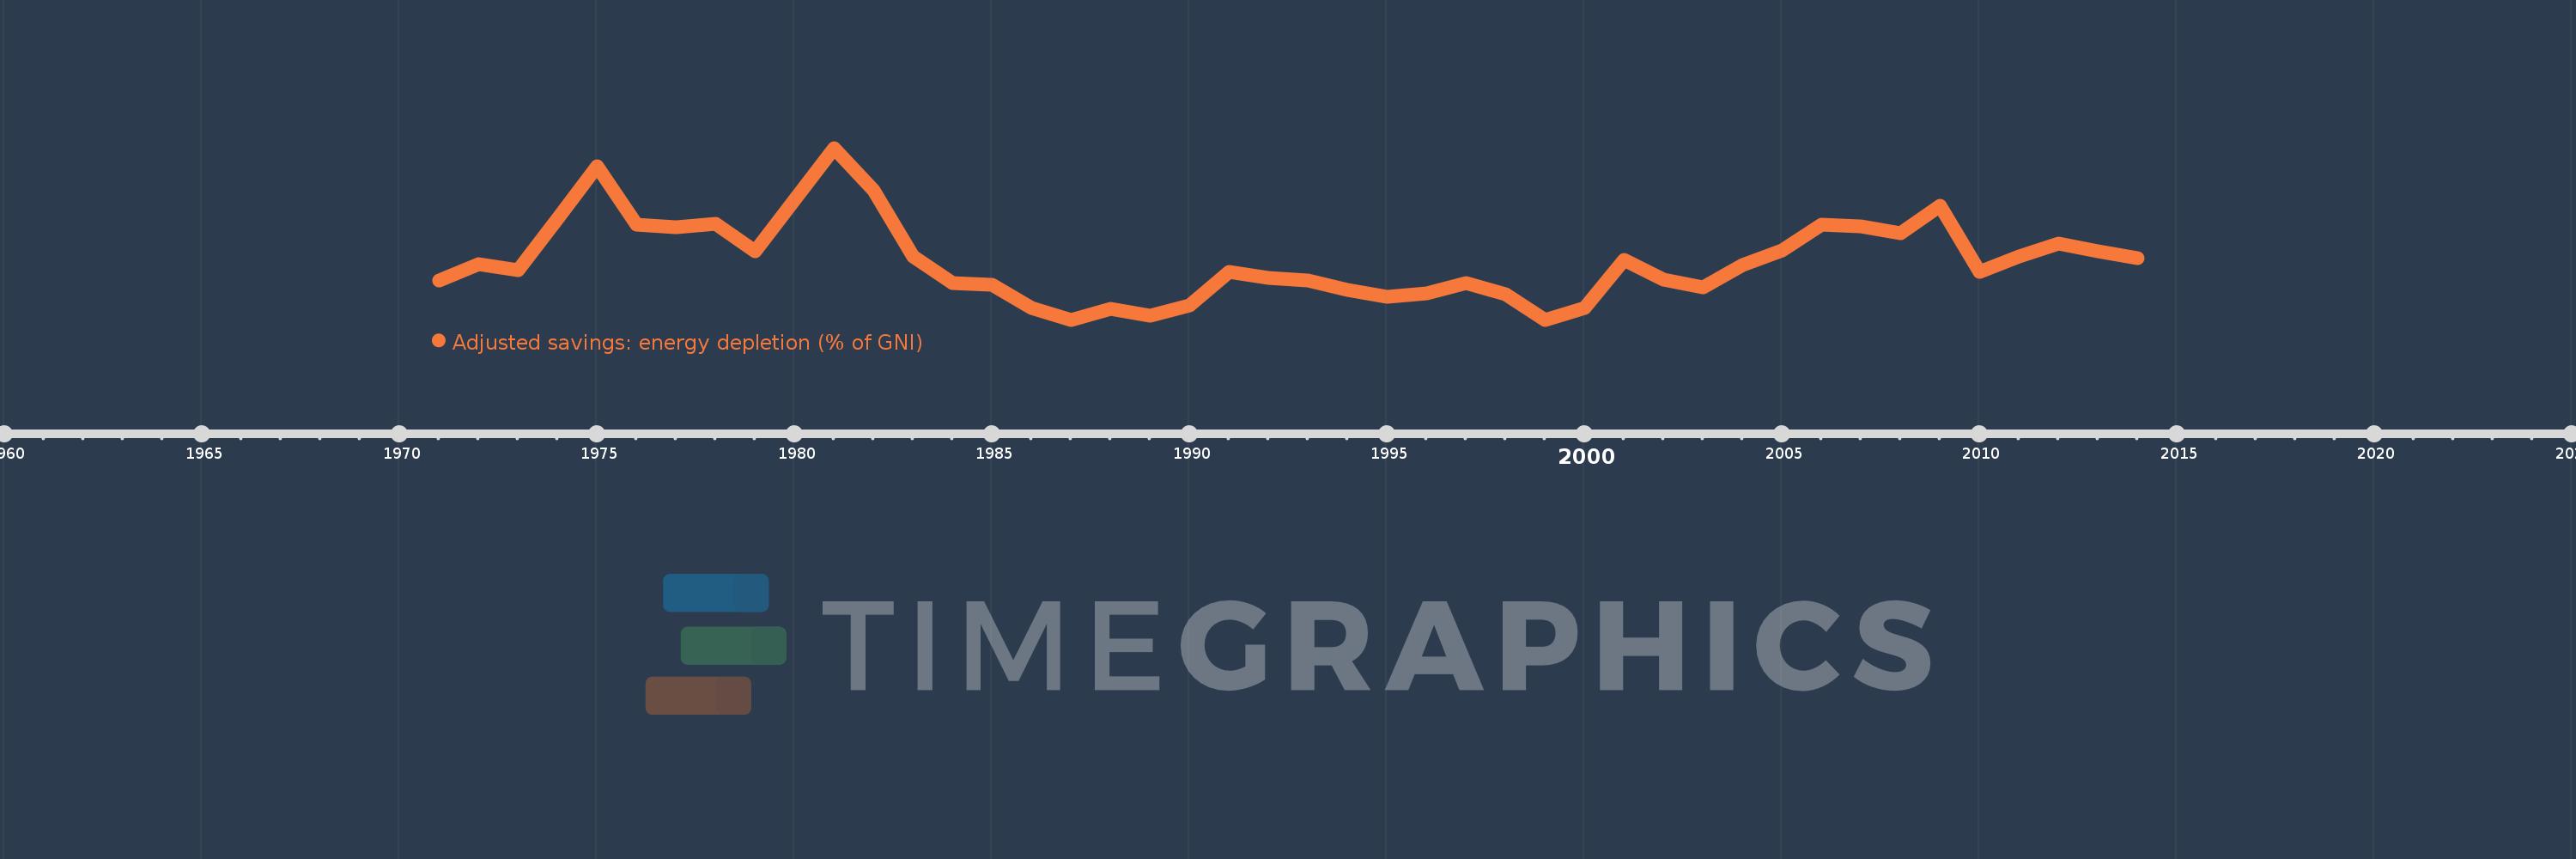
Adjusted savings: energy depletion (% of GNI)
2014,2013,2012,2011,2010,2009,2008,2007,2006,2005,2004,2003,2002,2001,2000,1999,1998,1997,1996,1995,1994,1993,1992,1991,1990,1989,1988,1987,1986,1985,1984,1983,1982,1981,1979,1978,1977,1976,1975,1974,1973,1972,1971
This statistics in other country:
AfghanistanAlbaniaAlgeriaAmerican SamoaAndorraAngolaAntigua and BarbudaArab WorldArgentinaArmeniaAustraliaAustriaAzerbaijanBahamas, TheBahrainBangladeshBarbadosBelarusBelgiumBelizeBeninBermudaBhutanBoliviaBosnia and HerzegovinaBotswanaBrazilBrunei DarussalamBulgariaBurkina FasoBurundiCabo VerdeCambodiaCameroonCanadaCaribbean small statesCentral African RepublicCentral Europe and the BalticsChadChannel IslandsChileChinaColombiaComorosCongo, Dem. Rep.Congo, Rep.Costa RicaCote d'IvoireCroatiaCubaCyprusCzech RepublicDenmarkDjiboutiDominicaDominican RepublicEarly-demographic dividendEast Asia & PacificEast Asia & Pacific (excluding high income)East Asia & Pacific (IDA & IBRD countries)EcuadorEgypt, Arab Rep.El SalvadorEquatorial GuineaEritreaEstoniaEthiopiaEuro areaEurope & Central AsiaEurope & Central Asia (excluding high income)Europe & Central Asia (IDA & IBRD countries)European UnionFaroe IslandsFijiFinlandFragile and conflict affected situationsFranceFrench PolynesiaGabonGambia, TheGeorgiaGermanyGhanaGreeceGreenlandGrenadaGuatemalaGuineaGuinea-BissauGuyanaHaitiHeavily indebted poor countries (HIPC)High incomeHondurasHong Kong SAR, ChinaHungaryIBRD onlyIcelandIDA & IBRD totalIDA blendIDA onlyIDA totalIndiaIndonesiaIran, Islamic Rep.IraqIrelandIsle of ManIsraelItalyJamaicaJapanJordanKazakhstanKenyaKiribatiKorea, Rep.KosovoKuwaitKyrgyz RepublicLao PDRLate-demographic dividendLatin America & Caribbean Latin America & Caribbean (excluding high income)Latin America & the Caribbean (IDA & IBRD countries)LatviaLeast developed countries: UN classificationLebanonLesothoLiberiaLibyaLiechtensteinLithuaniaLow & middle incomeLow incomeLower middle incomeLuxembourgMacao SAR, ChinaMacedonia, FYRMadagascarMalawiMalaysiaMaldivesMaliMaltaMarshall IslandsMauritaniaMauritiusMexicoMicronesia, Fed. Sts.Middle East & North AfricaMiddle East & North Africa (excluding high income)Middle East & North Africa (IDA & IBRD countries)Middle incomeMoldovaMonacoMongoliaMontenegroMoroccoMozambiqueMyanmarNamibiaNepalNetherlandsNew CaledoniaNew ZealandNicaraguaNigerNigeriaNorth AmericaNorwayOECD membersOmanOther small statesPacific island small statesPakistanPalauPanamaPapua New GuineaParaguayPeruPhilippinesPolandPortugalPost-demographic dividendPre-demographic dividendPuerto RicoQatarRomaniaRussian FederationRwandaSamoaSan MarinoSao Tome and PrincipeSaudi ArabiaSenegalSerbiaSeychellesSierra LeoneSingaporeSlovak RepublicSloveniaSmall statesSolomon IslandsSomaliaSouth AfricaSouth AsiaSouth Asia (IDA & IBRD)South SudanSpainSri LankaSt. Kitts and NevisSt. LuciaSt. Vincent and the GrenadinesSub-Saharan Africa Sub-Saharan Africa (excluding high income)Sub-Saharan Africa (IDA & IBRD countries)SudanSurinameSwazilandSwedenSwitzerlandSyrian Arab RepublicTajikistanTanzaniaThailandTimor-LesteTogoTongaTrinidad and TobagoTunisiaTurkeyTurkmenistanTuvaluUgandaUkraineUnited Arab EmiratesUnited KingdomUnited StatesUpper middle incomeUruguayUzbekistanVanuatuVenezuela, RBVietnamVirgin Islands (U.S.)West Bank and GazaWorldYemen, Rep.ZambiaZimbabwe Timeline:
This timeline shows a graph from 1971 to 2014 of Saudi Arabia. No data until 1970. Number of actual observations by date: 43.
Source name:
World Development Indicators
Source organization:
World Bank staff estimates based on sources and methods in World Bank's "The Changing Wealth of Nations: Measuring Sustainable Development in the New Millennium" (2011).
Categories, topics:
Economy & Growth, Energy & Mining, Environment
Last updated:
apr 23, 2017
Indicators value changes by year
Minimum:
10.892
jan 1, 1987
Maximum:
37.422
jan 1, 1981
At the date of observation
Value
Absolute change
Change from previous value
jan 1, 1971
16.927
+16.927
0.0%
jan 1, 1972
19.502
+2.576
15.22%
jan 1, 1973
18.504
-0.998
-5.12%
jan 1, 1974
26.56
+8.056
43.54%
jan 1, 1975
34.588
+8.027
30.22%
jan 1, 1976
25.514
-9.074
-26.23%
jan 1, 1977
25.232
-0.282
-1.11%
jan 1, 1978
25.716
+0.484
1.92%
jan 1, 1979
21.514
-4.201
-16.34%
jan 1, 1981
37.422
+15.908
73.94%
jan 1, 1982
30.931
-6.491
-17.35%
jan 1, 1983
20.605
-10.326
-33.39%
jan 1, 1984
16.55
-4.055
-19.68%
jan 1, 1985
16.252
-0.298
-1.8%
jan 1, 1986
12.684
-3.567
-21.95%
jan 1, 1987
10.892
-1.792
-14.13%
jan 1, 1988
12.544
+1.652
15.16%
jan 1, 1989
11.528
-1.016
-8.1%
jan 1, 1990
13.113
+1.585
13.75%
jan 1, 1991
18.313
+5.2
39.65%
jan 1, 1992
17.39
-0.923
-5.04%
jan 1, 1993
16.973
-0.417
-2.4%
jan 1, 1994
15.506
-1.466
-8.64%
jan 1, 1995
14.491
-1.015
-6.55%
jan 1, 1996
14.904
+0.413
2.85%
jan 1, 1997
16.491
+1.587
10.65%
jan 1, 1998
14.898
-1.594
-9.66%
jan 1, 1999
10.906
-3.992
-26.8%
jan 1, 2000
12.771
+1.866
17.11%
jan 1, 2001
20.2
+7.429
58.17%
jan 1, 2002
17.142
-3.058
-15.14%
jan 1, 2003
15.879
-1.263
-7.37%
jan 1, 2004
19.281
+3.403
21.43%
jan 1, 2005
21.616
+2.335
12.11%
jan 1, 2006
25.538
+3.923
18.15%
jan 1, 2007
25.343
-0.195
-0.76%
jan 1, 2008
24.26
-1.084
-4.28%
jan 1, 2009
28.431
+4.172
17.2%
jan 1, 2010
18.34
-10.091
-35.49%
jan 1, 2011
20.689
+2.349
12.81%
jan 1, 2012
22.709
+2.02
9.76%
jan 1, 2013
21.407
-1.302
-5.73%
jan 1, 2014
20.397
-1.009
-4.71%
Ranking of countries by current statistics by years


Comments: