29
/
en
AIzaSyAYiBZKx7MnpbEhh9jyipgxe19OcubqV5w
April 1, 2024
257968
Syrian Arab Republic
SYR
true
2
1
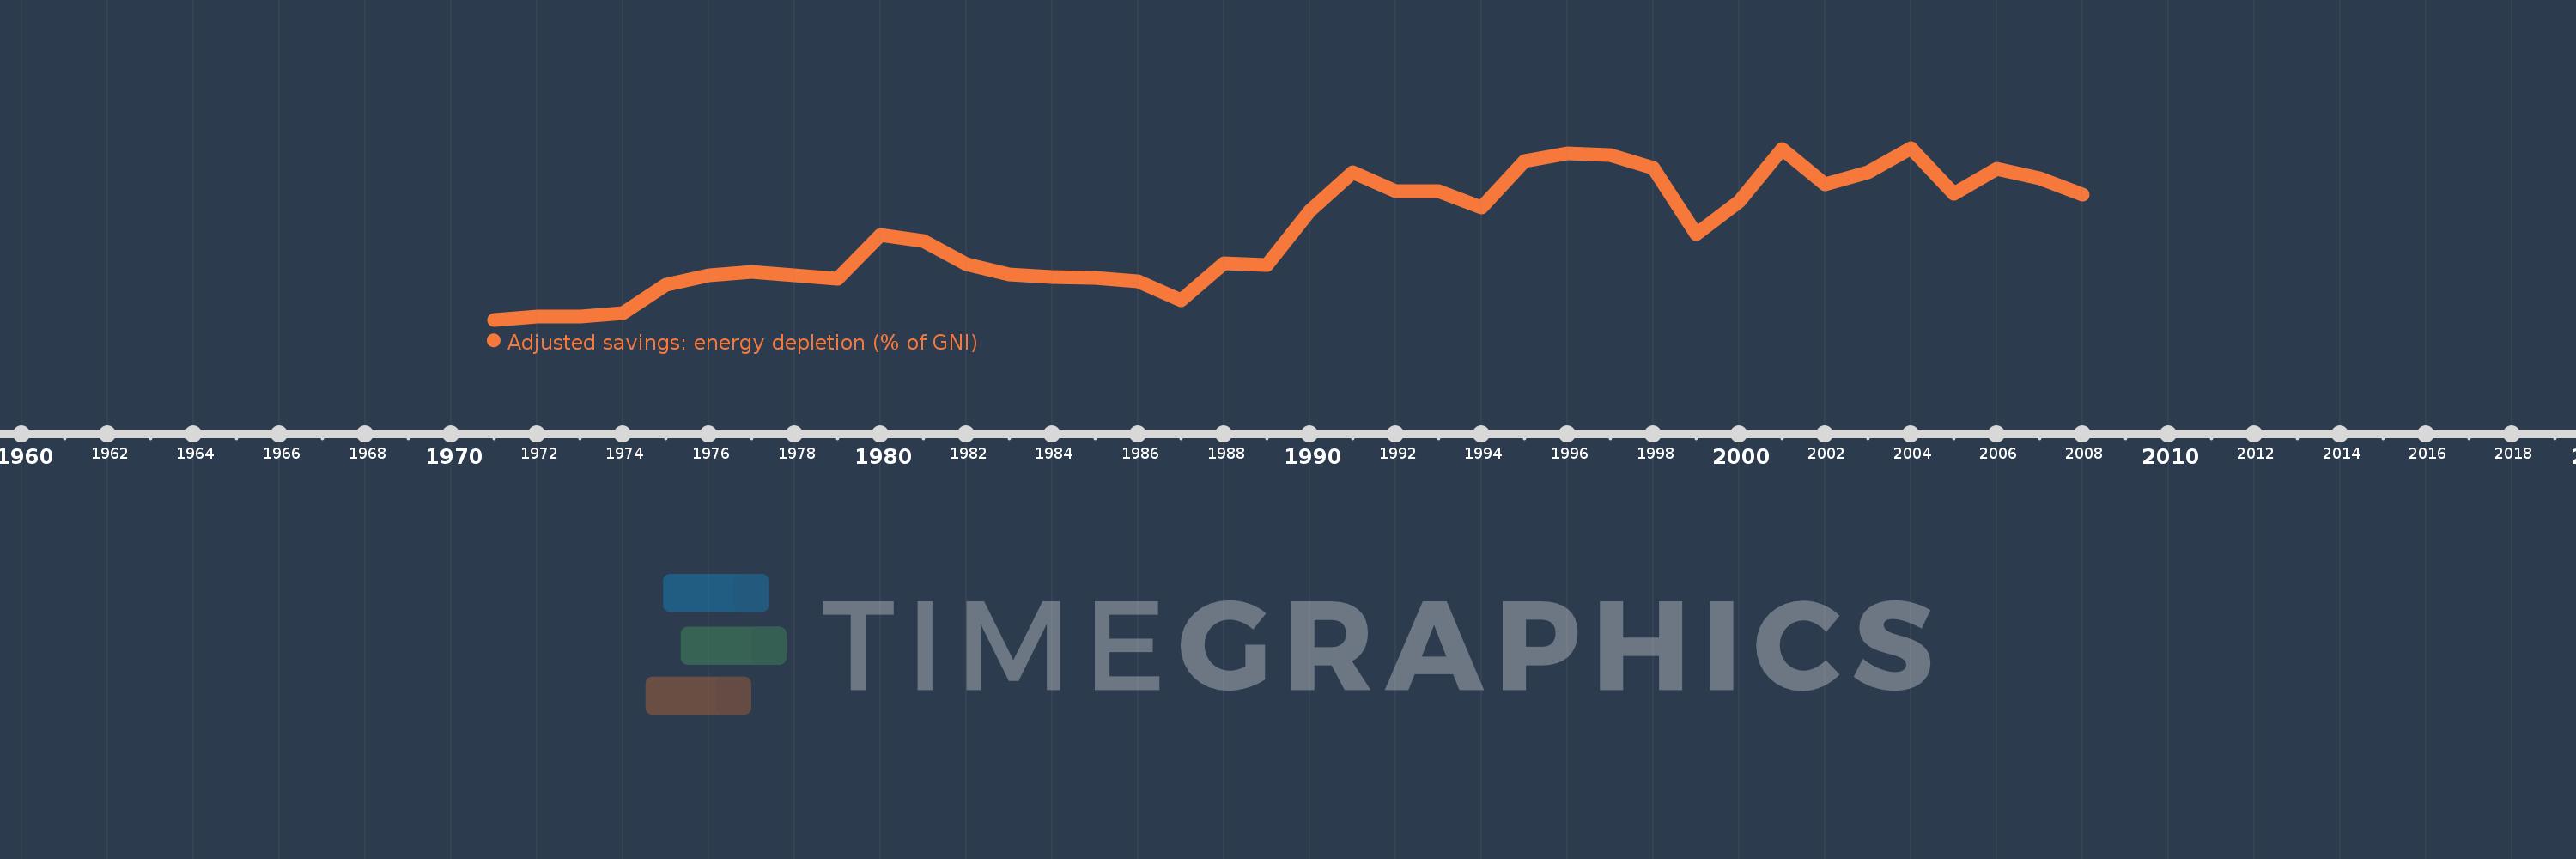
Adjusted savings: energy depletion (% of GNI)
2008,2007,2006,2005,2004,2003,2002,2001,2000,1999,1998,1997,1996,1995,1994,1993,1992,1991,1990,1989,1988,1987,1986,1985,1984,1983,1982,1981,1980,1979,1978,1977,1976,1975,1974,1973,1972,1971
This statistics in other country:
AfghanistanAlbaniaAlgeriaAmerican SamoaAndorraAngolaAntigua and BarbudaArab WorldArgentinaArmeniaAustraliaAustriaAzerbaijanBahamas, TheBahrainBangladeshBarbadosBelarusBelgiumBelizeBeninBermudaBhutanBoliviaBosnia and HerzegovinaBotswanaBrazilBrunei DarussalamBulgariaBurkina FasoBurundiCabo VerdeCambodiaCameroonCanadaCaribbean small statesCentral African RepublicCentral Europe and the BalticsChadChannel IslandsChileChinaColombiaComorosCongo, Dem. Rep.Congo, Rep.Costa RicaCote d'IvoireCroatiaCubaCyprusCzech RepublicDenmarkDjiboutiDominicaDominican RepublicEarly-demographic dividendEast Asia & PacificEast Asia & Pacific (excluding high income)East Asia & Pacific (IDA & IBRD countries)EcuadorEgypt, Arab Rep.El SalvadorEquatorial GuineaEritreaEstoniaEthiopiaEuro areaEurope & Central AsiaEurope & Central Asia (excluding high income)Europe & Central Asia (IDA & IBRD countries)European UnionFaroe IslandsFijiFinlandFragile and conflict affected situationsFranceFrench PolynesiaGabonGambia, TheGeorgiaGermanyGhanaGreeceGreenlandGrenadaGuatemalaGuineaGuinea-BissauGuyanaHaitiHeavily indebted poor countries (HIPC)High incomeHondurasHong Kong SAR, ChinaHungaryIBRD onlyIcelandIDA & IBRD totalIDA blendIDA onlyIDA totalIndiaIndonesiaIran, Islamic Rep.IraqIrelandIsle of ManIsraelItalyJamaicaJapanJordanKazakhstanKenyaKiribatiKorea, Rep.KosovoKuwaitKyrgyz RepublicLao PDRLate-demographic dividendLatin America & Caribbean Latin America & Caribbean (excluding high income)Latin America & the Caribbean (IDA & IBRD countries)LatviaLeast developed countries: UN classificationLebanonLesothoLiberiaLibyaLiechtensteinLithuaniaLow & middle incomeLow incomeLower middle incomeLuxembourgMacao SAR, ChinaMacedonia, FYRMadagascarMalawiMalaysiaMaldivesMaliMaltaMarshall IslandsMauritaniaMauritiusMexicoMicronesia, Fed. Sts.Middle East & North AfricaMiddle East & North Africa (excluding high income)Middle East & North Africa (IDA & IBRD countries)Middle incomeMoldovaMonacoMongoliaMontenegroMoroccoMozambiqueMyanmarNamibiaNepalNetherlandsNew CaledoniaNew ZealandNicaraguaNigerNigeriaNorth AmericaNorwayOECD membersOmanOther small statesPacific island small statesPakistanPalauPanamaPapua New GuineaParaguayPeruPhilippinesPolandPortugalPost-demographic dividendPre-demographic dividendPuerto RicoQatarRomaniaRussian FederationRwandaSamoaSan MarinoSao Tome and PrincipeSaudi ArabiaSenegalSerbiaSeychellesSierra LeoneSingaporeSlovak RepublicSloveniaSmall statesSolomon IslandsSomaliaSouth AfricaSouth AsiaSouth Asia (IDA & IBRD)South SudanSpainSri LankaSt. Kitts and NevisSt. LuciaSt. Vincent and the GrenadinesSub-Saharan Africa Sub-Saharan Africa (excluding high income)Sub-Saharan Africa (IDA & IBRD countries)SudanSurinameSwazilandSwedenSwitzerlandSyrian Arab RepublicTajikistanTanzaniaThailandTimor-LesteTogoTongaTrinidad and TobagoTunisiaTurkeyTurkmenistanTuvaluUgandaUkraineUnited Arab EmiratesUnited KingdomUnited StatesUpper middle incomeUruguayUzbekistanVanuatuVenezuela, RBVietnamVirgin Islands (U.S.)West Bank and GazaWorldYemen, Rep.ZambiaZimbabwe Timeline:
This timeline shows a graph from 1971 to 2008 of Syrian Arab Republic. No data until 1970. Number of actual observations by date: 38.
Source name:
World Development Indicators
Source organization:
World Bank staff estimates based on sources and methods in World Bank's "The Changing Wealth of Nations: Measuring Sustainable Development in the New Millennium" (2011).
Categories, topics:
Economy & Growth, Energy & Mining, Environment
Last updated:
apr 23, 2017
Indicators value changes by year
Maximum:
23.008
jan 1, 2004
At the date of observation
Value
Absolute change
Change from previous value
jan 1, 1971
0.782
+0.782
0.0%
jan 1, 1972
1.171
+0.39
49.84%
jan 1, 1973
1.225
+0.053
4.55%
jan 1, 1974
1.679
+0.455
37.13%
jan 1, 1975
5.281
+3.601
214.46%
jan 1, 1976
6.51
+1.229
23.28%
jan 1, 1977
6.973
+0.463
7.12%
jan 1, 1978
6.542
-0.431
-6.17%
jan 1, 1979
6.135
-0.407
-6.22%
jan 1, 1980
11.718
+5.583
90.99%
jan 1, 1981
11.02
-0.698
-5.95%
jan 1, 1982
8.02
-3.0
-27.22%
jan 1, 1983
6.629
-1.391
-17.34%
jan 1, 1984
6.255
-0.375
-5.65%
jan 1, 1985
6.169
-0.086
-1.37%
jan 1, 1986
5.699
-0.47
-7.62%
jan 1, 1987
3.329
-2.37
-41.59%
jan 1, 1988
8.108
+4.779
143.55%
jan 1, 1989
7.879
-0.228
-2.82%
jan 1, 1990
14.895
+7.016
89.04%
jan 1, 1991
19.887
+4.992
33.51%
jan 1, 1992
17.422
-2.465
-12.39%
jan 1, 1993
17.411
-0.012
-0.07%
jan 1, 1994
15.342
-2.068
-11.88%
jan 1, 1995
21.272
+5.929
38.65%
jan 1, 1996
22.254
+0.982
4.62%
jan 1, 1997
22.079
-0.175
-0.79%
jan 1, 1998
20.429
-1.65
-7.47%
jan 1, 1999
11.888
-8.541
-41.81%
jan 1, 2000
16.098
+4.21
35.42%
jan 1, 2001
22.892
+6.794
42.2%
jan 1, 2002
18.349
-4.543
-19.84%
jan 1, 2003
19.811
+1.461
7.96%
jan 1, 2004
23.008
+3.198
16.14%
jan 1, 2005
17.059
-5.949
-25.86%
jan 1, 2006
20.352
+3.293
19.3%
jan 1, 2007
19.068
-1.285
-6.31%
jan 1, 2008
16.955
-2.113
-11.08%
Ranking of countries by current statistics by years


Comments: