29
/
en
AIzaSyAYiBZKx7MnpbEhh9jyipgxe19OcubqV5w
April 1, 2024
276340
United States
USA
true
2
1
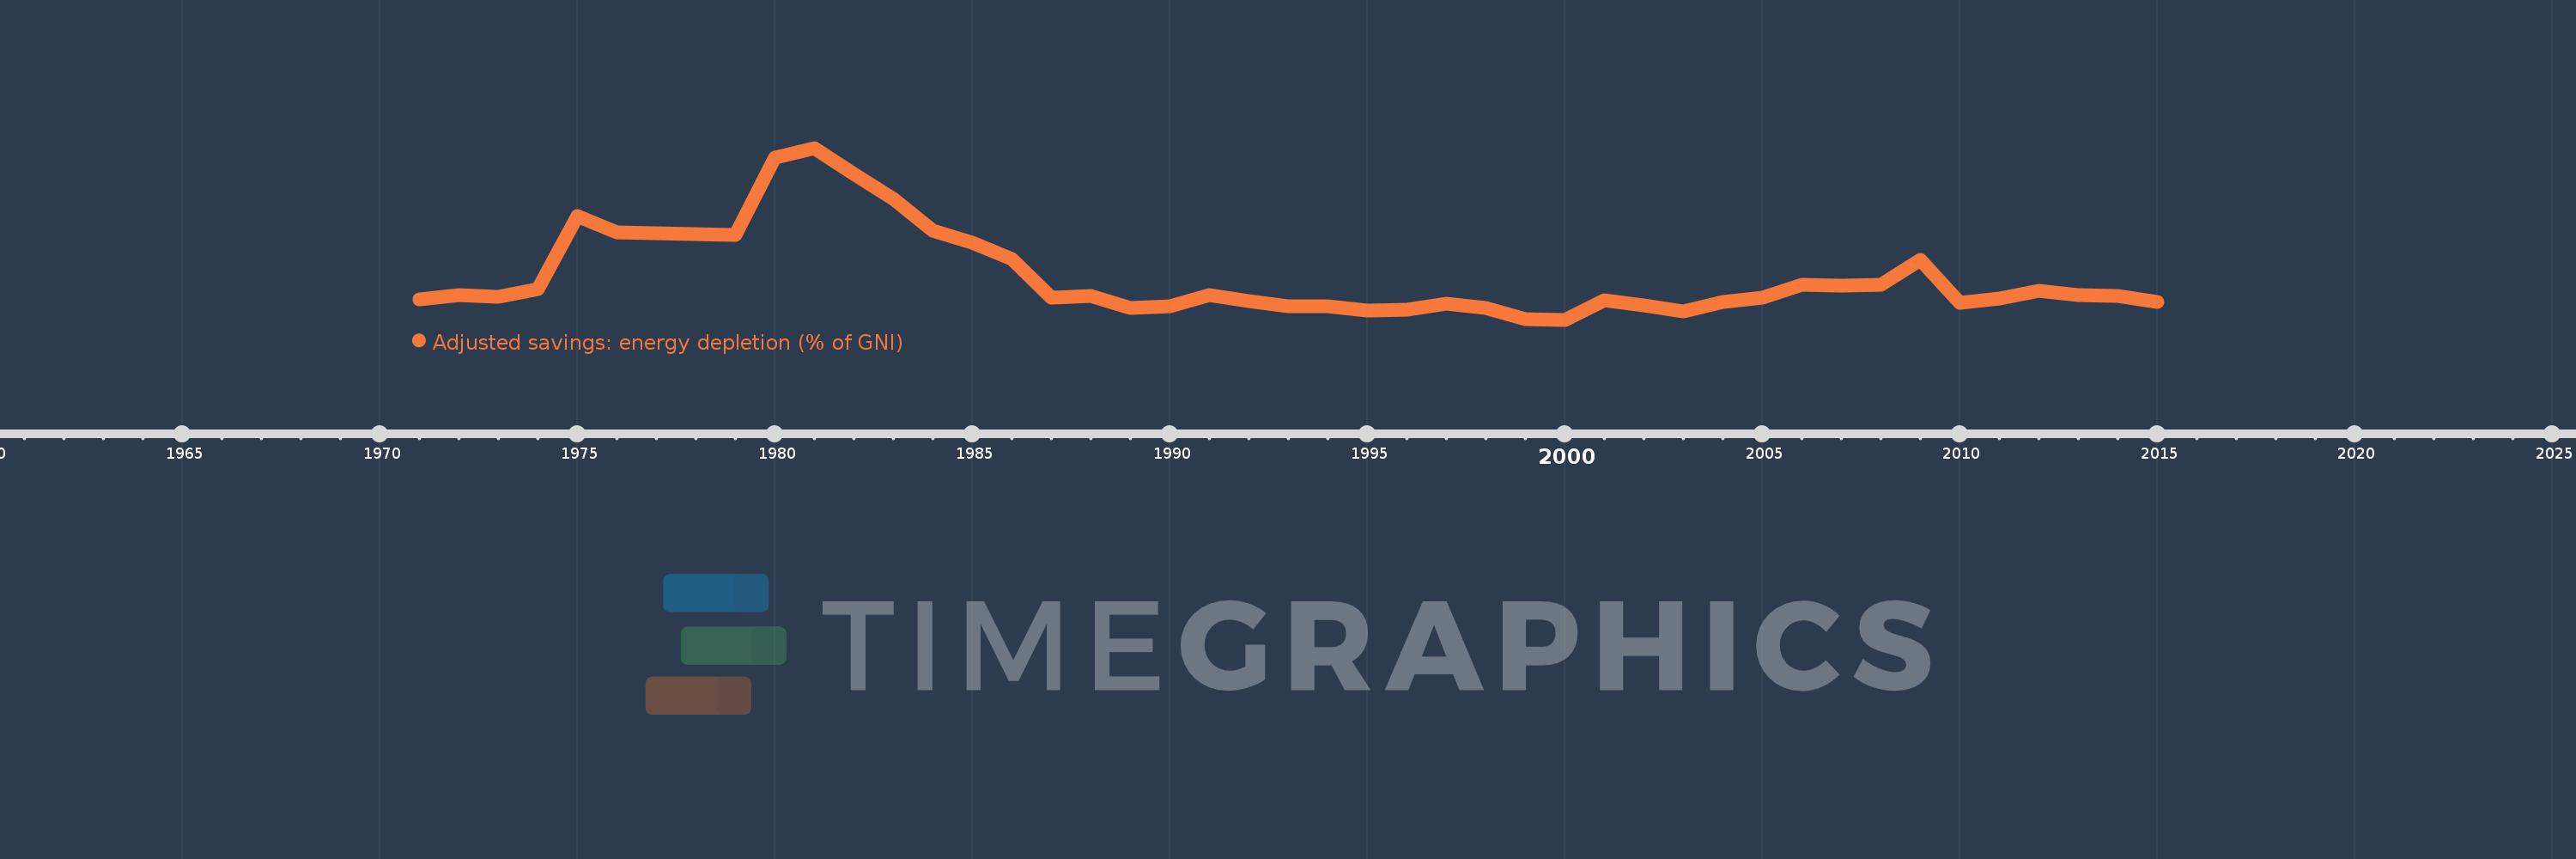
Adjusted savings: energy depletion (% of GNI)
2015,2014,2013,2012,2011,2010,2009,2008,2007,2006,2005,2004,2003,2002,2001,2000,1999,1998,1997,1996,1995,1994,1993,1992,1991,1990,1989,1988,1987,1986,1985,1984,1983,1982,1981,1980,1979,1978,1977,1976,1975,1974,1973,1972,1971
This statistics in other country:
AfghanistanAlbaniaAlgeriaAmerican SamoaAndorraAngolaAntigua and BarbudaArab WorldArgentinaArmeniaAustraliaAustriaAzerbaijanBahamas, TheBahrainBangladeshBarbadosBelarusBelgiumBelizeBeninBermudaBhutanBoliviaBosnia and HerzegovinaBotswanaBrazilBrunei DarussalamBulgariaBurkina FasoBurundiCabo VerdeCambodiaCameroonCanadaCaribbean small statesCentral African RepublicCentral Europe and the BalticsChadChannel IslandsChileChinaColombiaComorosCongo, Dem. Rep.Congo, Rep.Costa RicaCote d'IvoireCroatiaCubaCyprusCzech RepublicDenmarkDjiboutiDominicaDominican RepublicEarly-demographic dividendEast Asia & PacificEast Asia & Pacific (excluding high income)East Asia & Pacific (IDA & IBRD countries)EcuadorEgypt, Arab Rep.El SalvadorEquatorial GuineaEritreaEstoniaEthiopiaEuro areaEurope & Central AsiaEurope & Central Asia (excluding high income)Europe & Central Asia (IDA & IBRD countries)European UnionFaroe IslandsFijiFinlandFragile and conflict affected situationsFranceFrench PolynesiaGabonGambia, TheGeorgiaGermanyGhanaGreeceGreenlandGrenadaGuatemalaGuineaGuinea-BissauGuyanaHaitiHeavily indebted poor countries (HIPC)High incomeHondurasHong Kong SAR, ChinaHungaryIBRD onlyIcelandIDA & IBRD totalIDA blendIDA onlyIDA totalIndiaIndonesiaIran, Islamic Rep.IraqIrelandIsle of ManIsraelItalyJamaicaJapanJordanKazakhstanKenyaKiribatiKorea, Rep.KosovoKuwaitKyrgyz RepublicLao PDRLate-demographic dividendLatin America & Caribbean Latin America & Caribbean (excluding high income)Latin America & the Caribbean (IDA & IBRD countries)LatviaLeast developed countries: UN classificationLebanonLesothoLiberiaLibyaLiechtensteinLithuaniaLow & middle incomeLow incomeLower middle incomeLuxembourgMacao SAR, ChinaMacedonia, FYRMadagascarMalawiMalaysiaMaldivesMaliMaltaMarshall IslandsMauritaniaMauritiusMexicoMicronesia, Fed. Sts.Middle East & North AfricaMiddle East & North Africa (excluding high income)Middle East & North Africa (IDA & IBRD countries)Middle incomeMoldovaMonacoMongoliaMontenegroMoroccoMozambiqueMyanmarNamibiaNepalNetherlandsNew CaledoniaNew ZealandNicaraguaNigerNigeriaNorth AmericaNorwayOECD membersOmanOther small statesPacific island small statesPakistanPalauPanamaPapua New GuineaParaguayPeruPhilippinesPolandPortugalPost-demographic dividendPre-demographic dividendPuerto RicoQatarRomaniaRussian FederationRwandaSamoaSan MarinoSao Tome and PrincipeSaudi ArabiaSenegalSerbiaSeychellesSierra LeoneSingaporeSlovak RepublicSloveniaSmall statesSolomon IslandsSomaliaSouth AfricaSouth AsiaSouth Asia (IDA & IBRD)South SudanSpainSri LankaSt. Kitts and NevisSt. LuciaSt. Vincent and the GrenadinesSub-Saharan Africa Sub-Saharan Africa (excluding high income)Sub-Saharan Africa (IDA & IBRD countries)SudanSurinameSwazilandSwedenSwitzerlandSyrian Arab RepublicTajikistanTanzaniaThailandTimor-LesteTogoTongaTrinidad and TobagoTunisiaTurkeyTurkmenistanTuvaluUgandaUkraineUnited Arab EmiratesUnited KingdomUnited StatesUpper middle incomeUruguayUzbekistanVanuatuVenezuela, RBVietnamVirgin Islands (U.S.)West Bank and GazaWorldYemen, Rep.ZambiaZimbabwe Timeline:
This timeline shows a graph from 1971 to 2015 of United States. No data until 1970. Number of actual observations by date: 45.
Source name:
World Development Indicators
Source organization:
World Bank staff estimates based on sources and methods in World Bank's "The Changing Wealth of Nations: Measuring Sustainable Development in the New Millennium" (2011).
Categories, topics:
Economy & Growth, Energy & Mining, Environment
Last updated:
apr 23, 2017
Indicators value changes by year
At the date of observation
Value
Absolute change
Change from previous value
jan 1, 1971
0.697
+0.697
0.0%
jan 1, 1972
0.797
+0.1
14.33%
jan 1, 1973
0.744
-0.052
-6.59%
jan 1, 1974
0.935
+0.191
25.62%
jan 1, 1975
2.71
+1.776
189.96%
jan 1, 1976
2.328
-0.382
-14.1%
jan 1, 1977
2.299
-0.029
-1.23%
jan 1, 1978
2.272
-0.027
-1.18%
jan 1, 1979
2.267
-0.006
-0.24%
jan 1, 1980
4.136
+1.869
82.48%
jan 1, 1981
4.379
+0.242
5.86%
jan 1, 1982
3.755
-0.623
-14.23%
jan 1, 1983
3.143
-0.612
-16.3%
jan 1, 1984
2.356
-0.787
-25.05%
jan 1, 1985
2.079
-0.277
-11.76%
jan 1, 1986
1.672
-0.407
-19.56%
jan 1, 1987
0.736
-0.937
-56.01%
jan 1, 1988
0.765
+0.03
4.04%
jan 1, 1989
0.491
-0.275
-35.88%
jan 1, 1990
0.526
+0.035
7.2%
jan 1, 1991
0.802
+0.276
52.4%
jan 1, 1992
0.647
-0.155
-19.32%
jan 1, 1993
0.529
-0.118
-18.27%
jan 1, 1994
0.513
-0.016
-3.04%
jan 1, 1995
0.422
-0.09
-17.65%
jan 1, 1996
0.432
+0.01
2.38%
jan 1, 1997
0.592
+0.16
37.01%
jan 1, 1998
0.491
-0.101
-17.02%
jan 1, 1999
0.218
-0.274
-55.73%
jan 1, 2000
0.195
-0.022
-10.27%
jan 1, 2001
0.674
+0.479
245.49%
jan 1, 2002
0.546
-0.129
-19.08%
jan 1, 2003
0.388
-0.157
-28.85%
jan 1, 2004
0.628
+0.24
61.79%
jan 1, 2005
0.743
+0.115
18.34%
jan 1, 2006
1.05
+0.307
41.3%
jan 1, 2007
1.03
-0.02
-1.91%
jan 1, 2008
1.048
+0.017
1.69%
jan 1, 2009
1.647
+0.599
57.2%
jan 1, 2010
0.607
-1.04
-63.12%
jan 1, 2011
0.708
+0.101
16.55%
jan 1, 2012
0.907
+0.199
28.13%
jan 1, 2013
0.787
-0.12
-13.24%
jan 1, 2014
0.77
-0.017
-2.17%
jan 1, 2015
0.635
-0.135
-17.5%
Ranking of countries by current statistics by years


Comments: