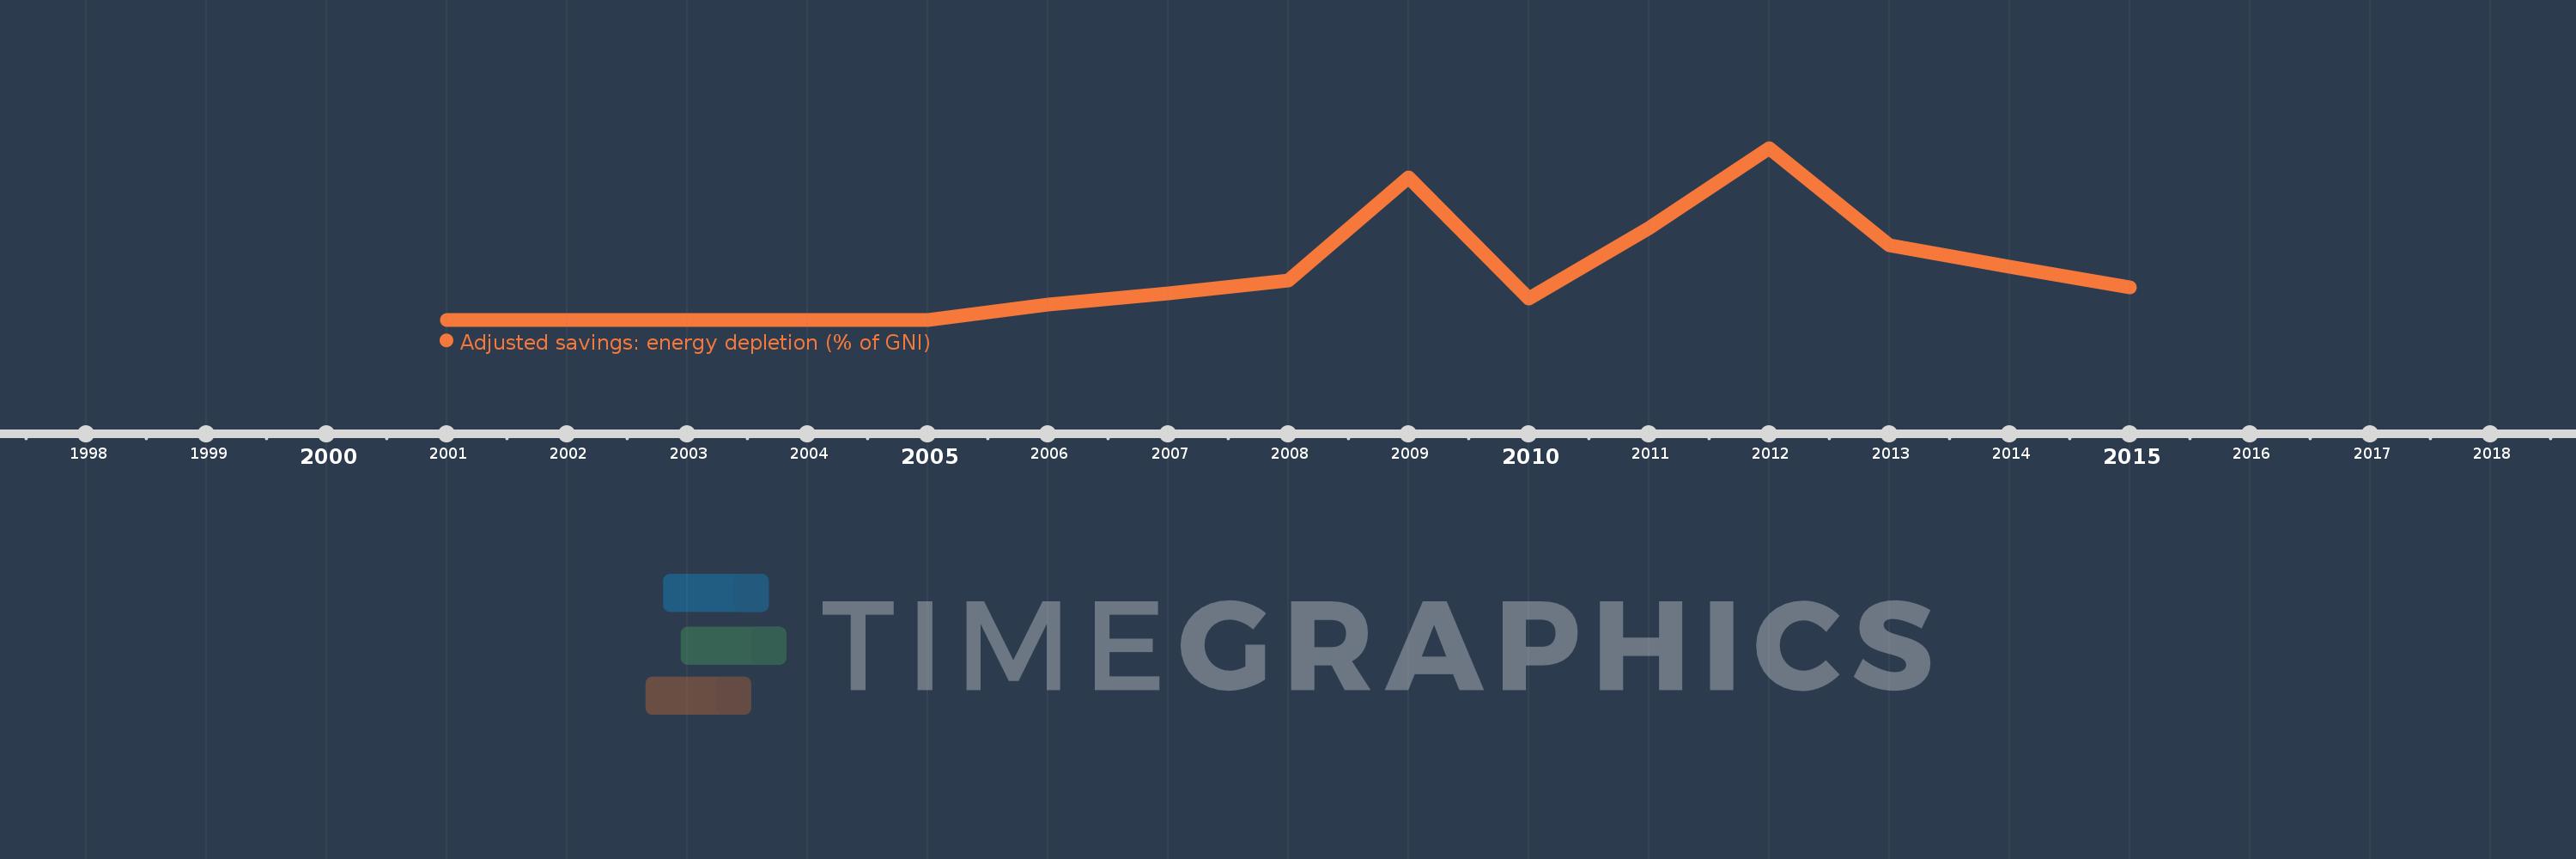
This timeline shows a graph from 2001 to 2015 of Montenegro. No data until 2000. Number of actual observations by date: 15.
Source name:
World Development Indicators
Source organization:
World Bank staff estimates based on sources and methods in World Bank's "The Changing Wealth of Nations: Measuring Sustainable Development in the New Millennium" (2011).
Categories, topics:
Economy & Growth, Energy & Mining, Environment
Last updated:
apr 23, 2017
Indicators value changes by year
Meaning:
0.049
Minimum:
0.0
jan 1, 2001
Maximum:
0.189
jan 1, 2012
At the date of observation
Value
Absolute change
Change from the previous value
jan 1, 2001
0.0
0.0
0.0%
jan 1, 2002
0.0
0.0
%
jan 1, 2003
0.0
0.0
%
jan 1, 2004
0.0
0.0
%
jan 1, 2005
0.0
0.0
%
jan 1, 2006
0.017
+0.017
%
jan 1, 2007
0.029
+0.013
75.57%
jan 1, 2008
0.043
+0.013
45.51%
jan 1, 2009
0.157
+0.114
266.58%
jan 1, 2010
0.023
-0.134
-85.6%
jan 1, 2011
0.101
+0.078
347.2%
jan 1, 2012
0.189
+0.088
87.27%
jan 1, 2013
0.082
-0.106
-56.33%
jan 1, 2014
0.058
-0.024
-29.64%
jan 1, 2015
0.036
-0.022
-38.44%
Ranking of countries by current statistics by years
