29
/
en
AIzaSyAYiBZKx7MnpbEhh9jyipgxe19OcubqV5w
April 1, 2024
123077
Ecuador
ECU
true
2
1
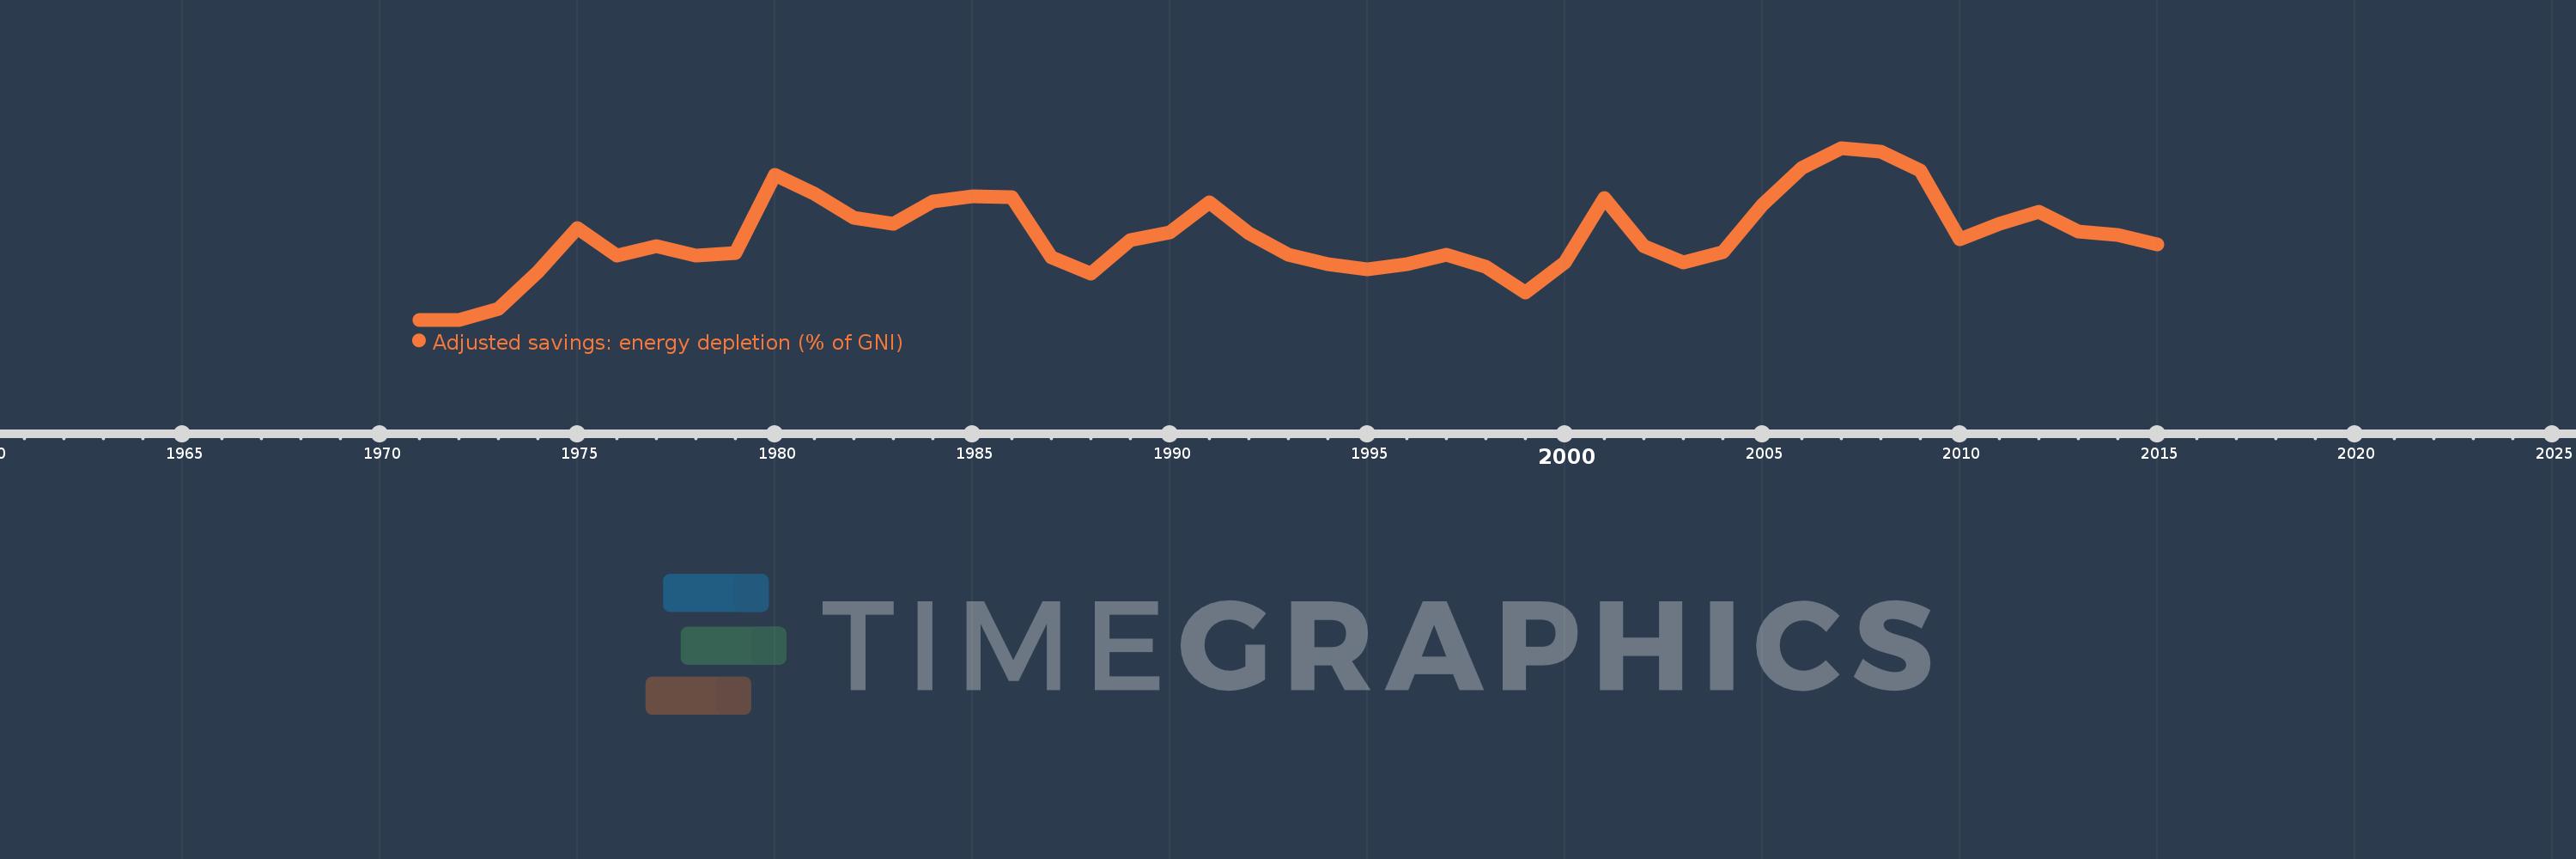
Adjusted savings: energy depletion (% of GNI)
2015,2014,2013,2012,2011,2010,2009,2008,2007,2006,2005,2004,2003,2002,2001,2000,1999,1998,1997,1996,1995,1994,1993,1992,1991,1990,1989,1988,1987,1986,1985,1984,1983,1982,1981,1980,1979,1978,1977,1976,1975,1974,1973,1972,1971
This statistics in other country:
AfghanistanAlbaniaAlgeriaAmerican SamoaAndorraAngolaAntigua and BarbudaArab WorldArgentinaArmeniaAustraliaAustriaAzerbaijanBahamas, TheBahrainBangladeshBarbadosBelarusBelgiumBelizeBeninBermudaBhutanBoliviaBosnia and HerzegovinaBotswanaBrazilBrunei DarussalamBulgariaBurkina FasoBurundiCabo VerdeCambodiaCameroonCanadaCaribbean small statesCentral African RepublicCentral Europe and the BalticsChadChannel IslandsChileChinaColombiaComorosCongo, Dem. Rep.Congo, Rep.Costa RicaCote d'IvoireCroatiaCubaCyprusCzech RepublicDenmarkDjiboutiDominicaDominican RepublicEarly-demographic dividendEast Asia & PacificEast Asia & Pacific (excluding high income)East Asia & Pacific (IDA & IBRD countries)EcuadorEgypt, Arab Rep.El SalvadorEquatorial GuineaEritreaEstoniaEthiopiaEuro areaEurope & Central AsiaEurope & Central Asia (excluding high income)Europe & Central Asia (IDA & IBRD countries)European UnionFaroe IslandsFijiFinlandFragile and conflict affected situationsFranceFrench PolynesiaGabonGambia, TheGeorgiaGermanyGhanaGreeceGreenlandGrenadaGuatemalaGuineaGuinea-BissauGuyanaHaitiHeavily indebted poor countries (HIPC)High incomeHondurasHong Kong SAR, ChinaHungaryIBRD onlyIcelandIDA & IBRD totalIDA blendIDA onlyIDA totalIndiaIndonesiaIran, Islamic Rep.IraqIrelandIsle of ManIsraelItalyJamaicaJapanJordanKazakhstanKenyaKiribatiKorea, Rep.KosovoKuwaitKyrgyz RepublicLao PDRLate-demographic dividendLatin America & Caribbean Latin America & Caribbean (excluding high income)Latin America & the Caribbean (IDA & IBRD countries)LatviaLeast developed countries: UN classificationLebanonLesothoLiberiaLibyaLiechtensteinLithuaniaLow & middle incomeLow incomeLower middle incomeLuxembourgMacao SAR, ChinaMacedonia, FYRMadagascarMalawiMalaysiaMaldivesMaliMaltaMarshall IslandsMauritaniaMauritiusMexicoMicronesia, Fed. Sts.Middle East & North AfricaMiddle East & North Africa (excluding high income)Middle East & North Africa (IDA & IBRD countries)Middle incomeMoldovaMonacoMongoliaMontenegroMoroccoMozambiqueMyanmarNamibiaNepalNetherlandsNew CaledoniaNew ZealandNicaraguaNigerNigeriaNorth AmericaNorwayOECD membersOmanOther small statesPacific island small statesPakistanPalauPanamaPapua New GuineaParaguayPeruPhilippinesPolandPortugalPost-demographic dividendPre-demographic dividendPuerto RicoQatarRomaniaRussian FederationRwandaSamoaSan MarinoSao Tome and PrincipeSaudi ArabiaSenegalSerbiaSeychellesSierra LeoneSingaporeSlovak RepublicSloveniaSmall statesSolomon IslandsSomaliaSouth AfricaSouth AsiaSouth Asia (IDA & IBRD)South SudanSpainSri LankaSt. Kitts and NevisSt. LuciaSt. Vincent and the GrenadinesSub-Saharan Africa Sub-Saharan Africa (excluding high income)Sub-Saharan Africa (IDA & IBRD countries)SudanSurinameSwazilandSwedenSwitzerlandSyrian Arab RepublicTajikistanTanzaniaThailandTimor-LesteTogoTongaTrinidad and TobagoTunisiaTurkeyTurkmenistanTuvaluUgandaUkraineUnited Arab EmiratesUnited KingdomUnited StatesUpper middle incomeUruguayUzbekistanVanuatuVenezuela, RBVietnamVirgin Islands (U.S.)West Bank and GazaWorldYemen, Rep.ZambiaZimbabwe Timeline:
This timeline shows a graph from 1971 to 2015 of Ecuador. No data until 1970. Number of actual observations by date: 45.
Source name:
World Development Indicators
Source organization:
World Bank staff estimates based on sources and methods in World Bank's "The Changing Wealth of Nations: Measuring Sustainable Development in the New Millennium" (2011).
Categories, topics:
Economy & Growth, Energy & Mining, Environment
Last updated:
apr 23, 2017
Indicators value changes by year
Maximum:
16.385
jan 1, 2007
At the date of observation
Value
Absolute change
Change from previous value
jan 1, 1971
0.023
+0.023
0.0%
jan 1, 1972
0.032
+0.009
36.63%
jan 1, 1973
1.044
+1.012
3.16K%
jan 1, 1974
4.542
+3.497
334.85%
jan 1, 1975
8.742
+4.2
92.48%
jan 1, 1976
6.159
-2.583
-29.55%
jan 1, 1977
7.008
+0.849
13.78%
jan 1, 1978
6.108
-0.899
-12.83%
jan 1, 1979
6.419
+0.311
5.08%
jan 1, 1980
13.82
+7.401
115.31%
jan 1, 1981
12.044
-1.776
-12.85%
jan 1, 1982
9.726
-2.318
-19.25%
jan 1, 1983
9.169
-0.557
-5.73%
jan 1, 1984
11.265
+2.097
22.87%
jan 1, 1985
11.803
+0.538
4.77%
jan 1, 1986
11.687
-0.116
-0.99%
jan 1, 1987
5.999
-5.688
-48.67%
jan 1, 1988
4.442
-1.557
-25.96%
jan 1, 1989
7.612
+3.17
71.38%
jan 1, 1990
8.357
+0.745
9.78%
jan 1, 1991
11.246
+2.889
34.57%
jan 1, 1992
8.293
-2.953
-26.26%
jan 1, 1993
6.234
-2.059
-24.83%
jan 1, 1994
5.332
-0.902
-14.47%
jan 1, 1995
4.861
-0.471
-8.83%
jan 1, 1996
5.313
+0.452
9.3%
jan 1, 1997
6.184
+0.871
16.39%
jan 1, 1998
5.068
-1.116
-18.04%
jan 1, 1999
2.649
-2.42
-47.74%
jan 1, 2000
5.447
+2.798
105.65%
jan 1, 2001
11.611
+6.164
113.17%
jan 1, 2002
7.045
-4.566
-39.32%
jan 1, 2003
5.511
-1.535
-21.78%
jan 1, 2004
6.437
+0.927
16.81%
jan 1, 2005
10.967
+4.529
70.36%
jan 1, 2006
14.477
+3.51
32.01%
jan 1, 2007
16.385
+1.908
13.18%
jan 1, 2008
16.053
-0.332
-2.03%
jan 1, 2009
14.251
-1.801
-11.22%
jan 1, 2010
7.657
-6.595
-46.27%
jan 1, 2011
9.177
+1.52
19.86%
jan 1, 2012
10.303
+1.126
12.26%
jan 1, 2013
8.411
-1.892
-18.36%
jan 1, 2014
8.118
-0.293
-3.49%
jan 1, 2015
7.173
-0.945
-11.64%
Ranking of countries by current statistics by years


Comments: