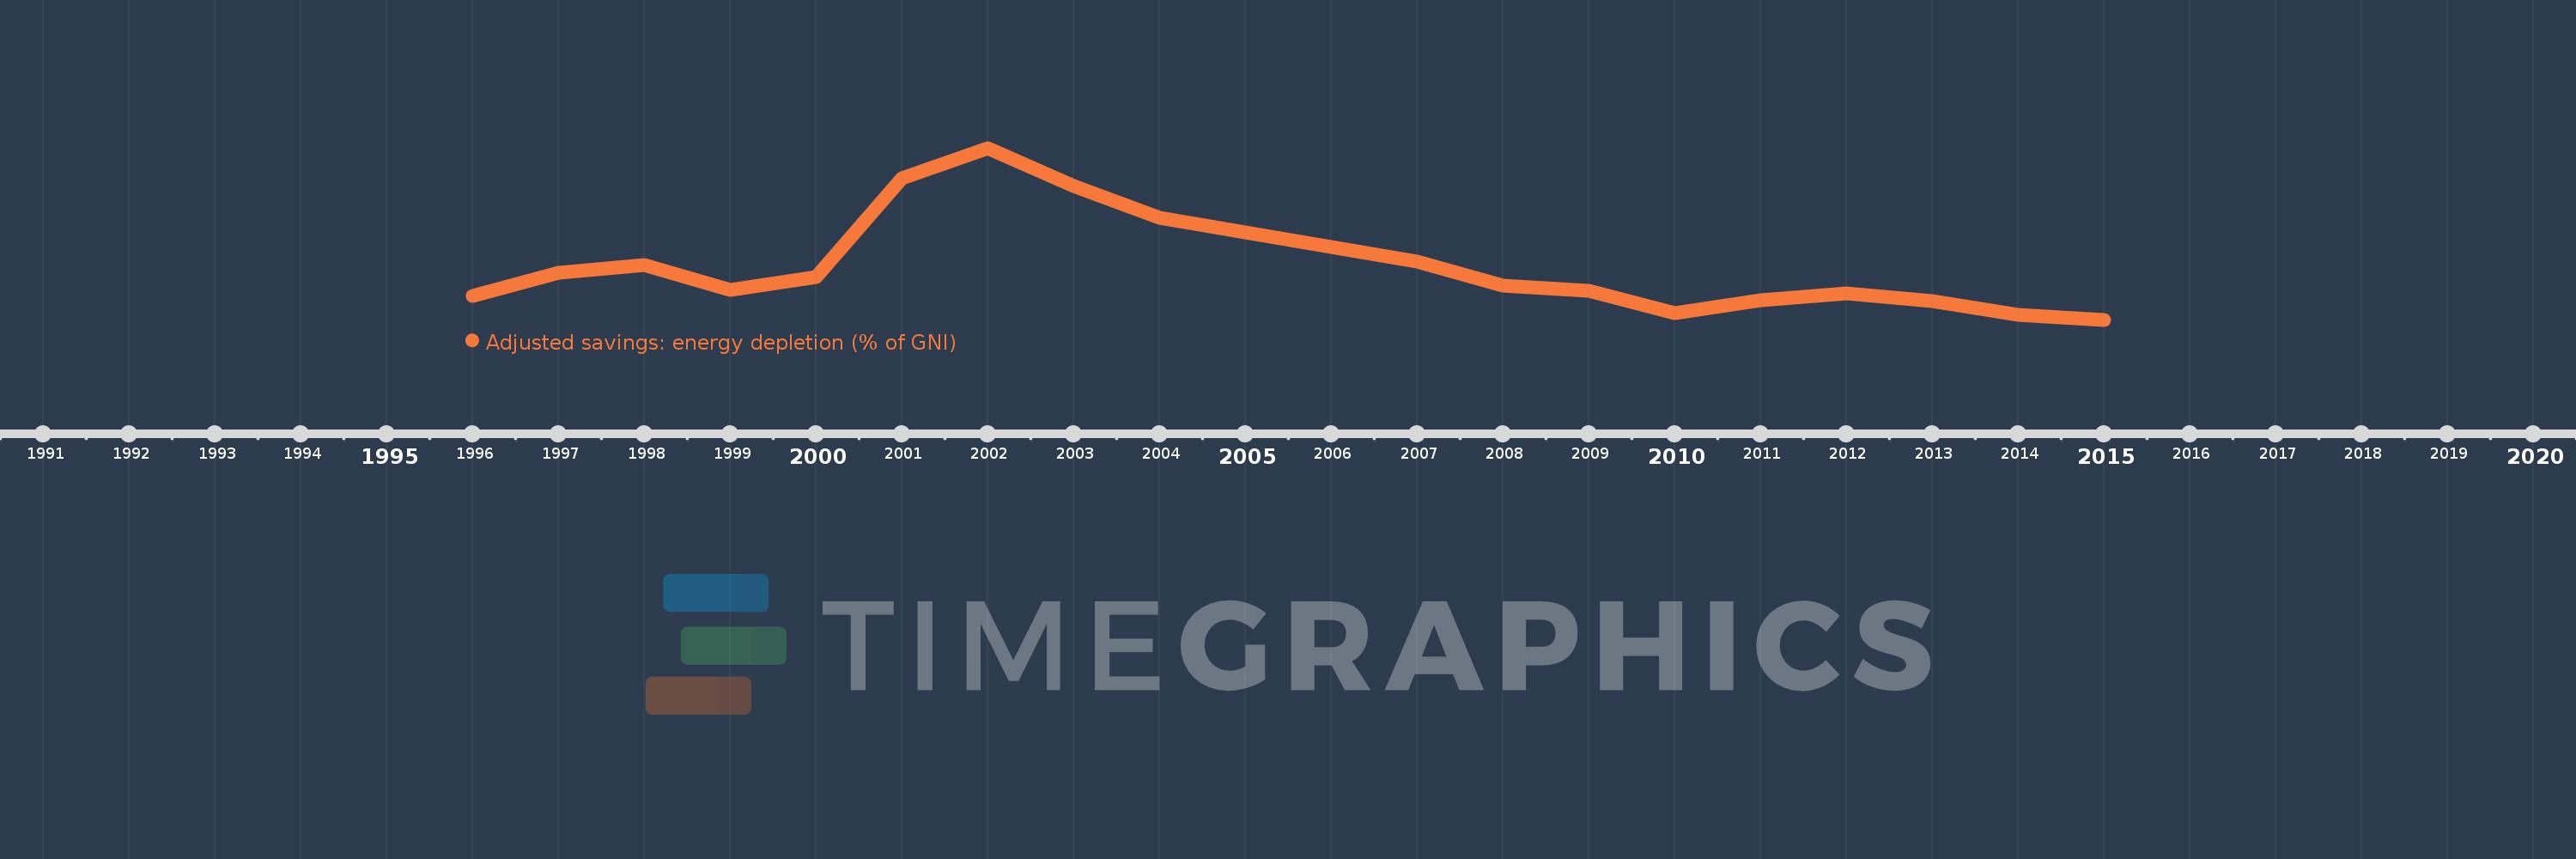
This timeline shows a graph from 1996 to 2015 of Lithuania. No data until 1995. Number of actual observations by date: 20.
Source name:
World Development Indicators
Source organization:
World Bank staff estimates based on sources and methods in World Bank's "The Changing Wealth of Nations: Measuring Sustainable Development in the New Millennium" (2011).
Categories, topics:
Economy & Growth, Energy & Mining, Environment
Last updated:
apr 23, 2017
Indicators value changes by year
Meaning:
0.202
Minimum:
0.064
jan 1, 2015
Maximum:
0.495
jan 1, 2002
At the date of observation
Value
Absolute change
Change from the previous value
jan 1, 1996
0.123
+0.123
0.0%
jan 1, 1997
0.181
+0.059
47.88%
jan 1, 1998
0.202
+0.021
11.39%
jan 1, 1999
0.139
-0.064
-31.44%
jan 1, 2000
0.171
+0.032
23.1%
jan 1, 2001
0.42
+0.249
146.22%
jan 1, 2002
0.495
+0.075
17.97%
jan 1, 2003
0.399
-0.096
-19.47%
jan 1, 2004
0.32
-0.079
-19.85%
jan 1, 2005
0.284
-0.036
-11.19%
jan 1, 2006
0.246
-0.038
-13.53%
jan 1, 2007
0.21
-0.036
-14.66%
jan 1, 2008
0.15
-0.059
-28.29%
jan 1, 2009
0.137
-0.013
-8.69%
jan 1, 2010
0.08
-0.058
-42.02%
jan 1, 2011
0.112
+0.032
40.75%
jan 1, 2012
0.131
+0.019
16.82%
jan 1, 2013
0.11
-0.02
-15.6%
jan 1, 2014
0.077
-0.033
-30.11%
jan 1, 2015
0.064
-0.014
-17.5%
Ranking of countries by current statistics by years
