29
/
en
AIzaSyAYiBZKx7MnpbEhh9jyipgxe19OcubqV5w
April 1, 2024
24644
Caribbean small states
CSS
false
2
1
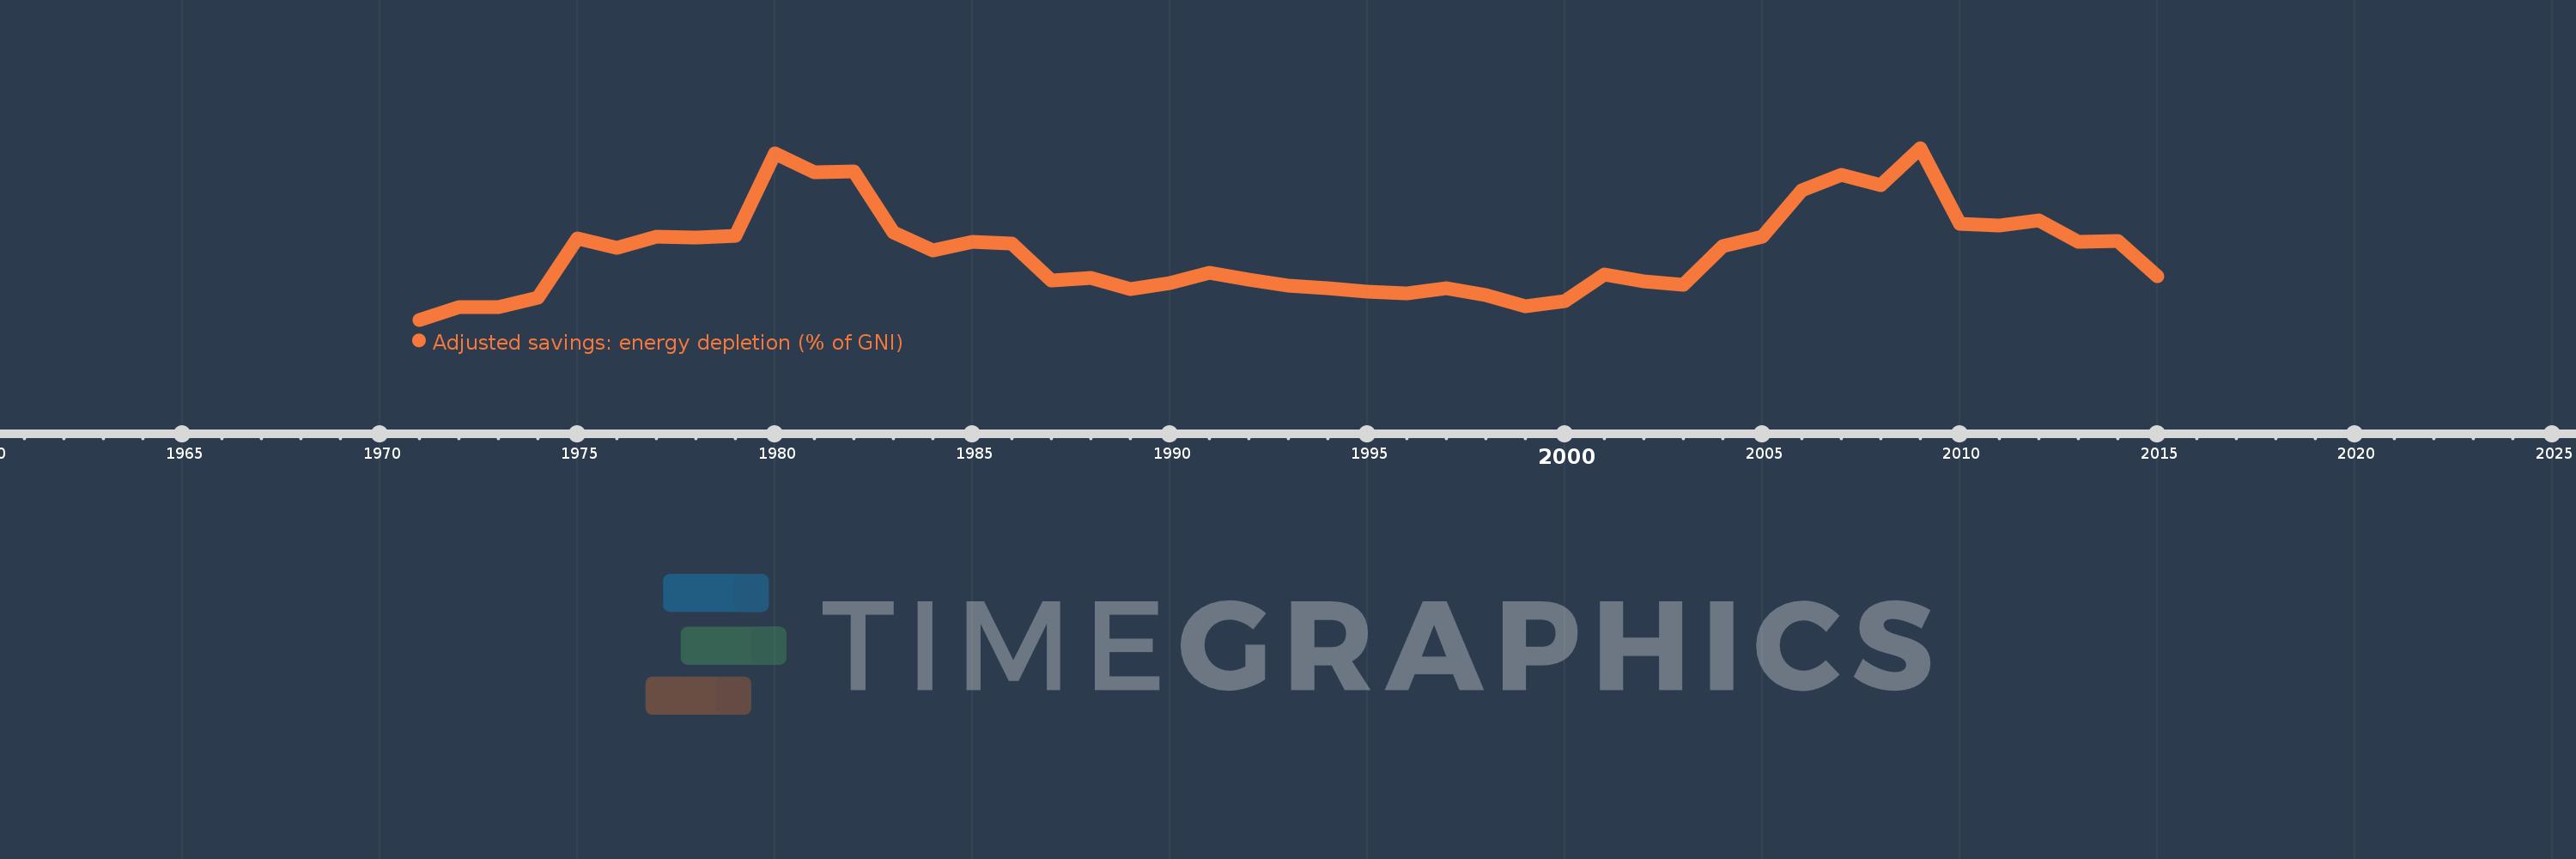
Adjusted savings: energy depletion (% of GNI)
2015,2014,2013,2012,2011,2010,2009,2008,2007,2006,2005,2004,2003,2002,2001,2000,1999,1998,1997,1996,1995,1994,1993,1992,1991,1990,1989,1988,1987,1986,1985,1984,1983,1982,1981,1980,1979,1978,1977,1976,1975,1974,1973,1972,1971
This statistics in other country:
AfghanistanAlbaniaAlgeriaAmerican SamoaAndorraAngolaAntigua and BarbudaArab WorldArgentinaArmeniaAustraliaAustriaAzerbaijanBahamas, TheBahrainBangladeshBarbadosBelarusBelgiumBelizeBeninBermudaBhutanBoliviaBosnia and HerzegovinaBotswanaBrazilBrunei DarussalamBulgariaBurkina FasoBurundiCabo VerdeCambodiaCameroonCanadaCaribbean small statesCentral African RepublicCentral Europe and the BalticsChadChannel IslandsChileChinaColombiaComorosCongo, Dem. Rep.Congo, Rep.Costa RicaCote d'IvoireCroatiaCubaCyprusCzech RepublicDenmarkDjiboutiDominicaDominican RepublicEarly-demographic dividendEast Asia & PacificEast Asia & Pacific (excluding high income)East Asia & Pacific (IDA & IBRD countries)EcuadorEgypt, Arab Rep.El SalvadorEquatorial GuineaEritreaEstoniaEthiopiaEuro areaEurope & Central AsiaEurope & Central Asia (excluding high income)Europe & Central Asia (IDA & IBRD countries)European UnionFaroe IslandsFijiFinlandFragile and conflict affected situationsFranceFrench PolynesiaGabonGambia, TheGeorgiaGermanyGhanaGreeceGreenlandGrenadaGuatemalaGuineaGuinea-BissauGuyanaHaitiHeavily indebted poor countries (HIPC)High incomeHondurasHong Kong SAR, ChinaHungaryIBRD onlyIcelandIDA & IBRD totalIDA blendIDA onlyIDA totalIndiaIndonesiaIran, Islamic Rep.IraqIrelandIsle of ManIsraelItalyJamaicaJapanJordanKazakhstanKenyaKiribatiKorea, Rep.KosovoKuwaitKyrgyz RepublicLao PDRLate-demographic dividendLatin America & Caribbean Latin America & Caribbean (excluding high income)Latin America & the Caribbean (IDA & IBRD countries)LatviaLeast developed countries: UN classificationLebanonLesothoLiberiaLibyaLiechtensteinLithuaniaLow & middle incomeLow incomeLower middle incomeLuxembourgMacao SAR, ChinaMacedonia, FYRMadagascarMalawiMalaysiaMaldivesMaliMaltaMarshall IslandsMauritaniaMauritiusMexicoMicronesia, Fed. Sts.Middle East & North AfricaMiddle East & North Africa (excluding high income)Middle East & North Africa (IDA & IBRD countries)Middle incomeMoldovaMonacoMongoliaMontenegroMoroccoMozambiqueMyanmarNamibiaNepalNetherlandsNew CaledoniaNew ZealandNicaraguaNigerNigeriaNorth AmericaNorwayOECD membersOmanOther small statesPacific island small statesPakistanPalauPanamaPapua New GuineaParaguayPeruPhilippinesPolandPortugalPost-demographic dividendPre-demographic dividendPuerto RicoQatarRomaniaRussian FederationRwandaSamoaSan MarinoSao Tome and PrincipeSaudi ArabiaSenegalSerbiaSeychellesSierra LeoneSingaporeSlovak RepublicSloveniaSmall statesSolomon IslandsSomaliaSouth AfricaSouth AsiaSouth Asia (IDA & IBRD)South SudanSpainSri LankaSt. Kitts and NevisSt. LuciaSt. Vincent and the GrenadinesSub-Saharan Africa Sub-Saharan Africa (excluding high income)Sub-Saharan Africa (IDA & IBRD countries)SudanSurinameSwazilandSwedenSwitzerlandSyrian Arab RepublicTajikistanTanzaniaThailandTimor-LesteTogoTongaTrinidad and TobagoTunisiaTurkeyTurkmenistanTuvaluUgandaUkraineUnited Arab EmiratesUnited KingdomUnited StatesUpper middle incomeUruguayUzbekistanVanuatuVenezuela, RBVietnamVirgin Islands (U.S.)West Bank and GazaWorldYemen, Rep.ZambiaZimbabwe Timeline:
This timeline shows a graph from 1971 to 2015 of Caribbean small states. No data until 1970. Number of actual observations by date: 45.
Source name:
World Development Indicators
Source organization:
World Bank staff estimates based on sources and methods in World Bank's "The Changing Wealth of Nations: Measuring Sustainable Development in the New Millennium" (2011).
Categories, topics:
Economy & Growth, Energy & Mining, Environment
Last updated:
apr 23, 2017
Indicators value changes by year
Maximum:
22.033
jan 1, 2009
At the date of observation
Value
Absolute change
Change from previous value
jan 1, 1971
0.256
+0.256
0.0%
jan 1, 1972
1.854
+1.598
625.36%
jan 1, 1973
1.811
-0.043
-2.31%
jan 1, 1974
3.035
+1.224
67.59%
jan 1, 1975
10.618
+7.583
249.89%
jan 1, 1976
9.373
-1.245
-11.72%
jan 1, 1977
10.792
+1.419
15.14%
jan 1, 1978
10.702
-0.089
-0.83%
jan 1, 1979
10.868
+0.165
1.55%
jan 1, 1980
21.325
+10.458
96.23%
jan 1, 1981
18.914
-2.412
-11.31%
jan 1, 1982
19.044
+0.13
0.69%
jan 1, 1983
11.38
-7.664
-40.25%
jan 1, 1984
8.996
-2.384
-20.95%
jan 1, 1985
10.166
+1.171
13.01%
jan 1, 1986
9.936
-0.23
-2.26%
jan 1, 1987
5.24
-4.697
-47.27%
jan 1, 1988
5.55
+0.31
5.92%
jan 1, 1989
4.163
-1.387
-24.99%
jan 1, 1990
4.937
+0.774
18.59%
jan 1, 1991
6.212
+1.275
25.82%
jan 1, 1992
5.353
-0.858
-13.82%
jan 1, 1993
4.622
-0.731
-13.66%
jan 1, 1994
4.258
-0.364
-7.88%
jan 1, 1995
3.836
-0.421
-9.89%
jan 1, 1996
3.618
-0.218
-5.68%
jan 1, 1997
4.21
+0.592
16.36%
jan 1, 1998
3.432
-0.779
-18.49%
jan 1, 1999
1.977
-1.454
-42.38%
jan 1, 2000
2.596
+0.619
31.31%
jan 1, 2001
5.974
+3.377
130.07%
jan 1, 2002
5.125
-0.849
-14.21%
jan 1, 2003
4.704
-0.421
-8.22%
jan 1, 2004
9.555
+4.851
103.14%
jan 1, 2005
10.809
+1.254
13.13%
jan 1, 2006
16.638
+5.828
53.92%
jan 1, 2007
18.612
+1.974
11.86%
jan 1, 2008
17.287
-1.325
-7.12%
jan 1, 2009
22.033
+4.746
27.45%
jan 1, 2010
12.419
-9.614
-43.64%
jan 1, 2011
12.215
-0.204
-1.65%
jan 1, 2012
12.834
+0.62
5.08%
jan 1, 2013
10.093
-2.742
-21.36%
jan 1, 2014
10.233
+0.14
1.39%
jan 1, 2015
5.817
-4.416
-43.16%
Ranking of countries by current statistics by years


Comments: