29
/
en
AIzaSyAYiBZKx7MnpbEhh9jyipgxe19OcubqV5w
April 1, 2024
195129
Mexico
MEX
true
2
1
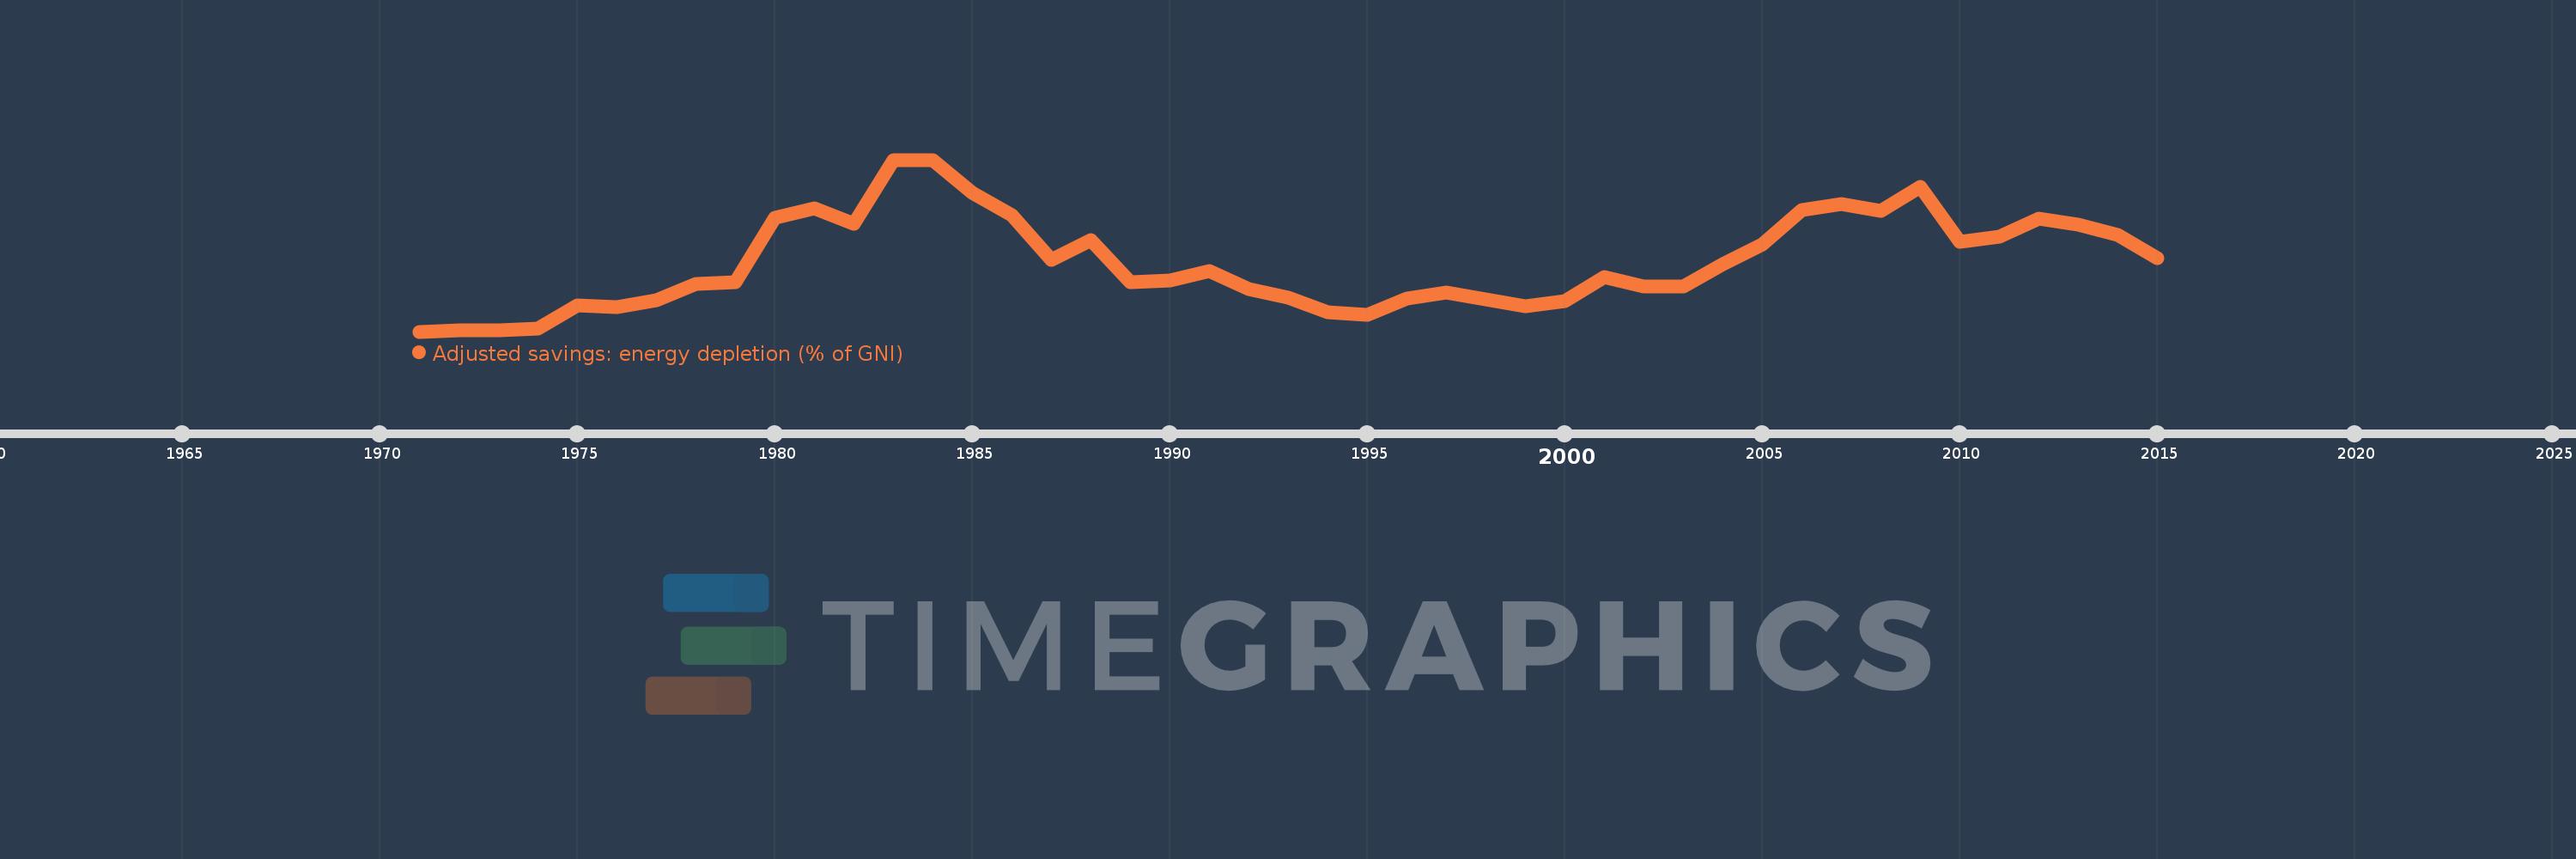
Adjusted savings: energy depletion (% of GNI)
2015,2014,2013,2012,2011,2010,2009,2008,2007,2006,2005,2004,2003,2002,2001,2000,1999,1998,1997,1996,1995,1994,1993,1992,1991,1990,1989,1988,1987,1986,1985,1984,1983,1982,1981,1980,1979,1978,1977,1976,1975,1974,1973,1972,1971
This statistics in other country:
AfghanistanAlbaniaAlgeriaAmerican SamoaAndorraAngolaAntigua and BarbudaArab WorldArgentinaArmeniaAustraliaAustriaAzerbaijanBahamas, TheBahrainBangladeshBarbadosBelarusBelgiumBelizeBeninBermudaBhutanBoliviaBosnia and HerzegovinaBotswanaBrazilBrunei DarussalamBulgariaBurkina FasoBurundiCabo VerdeCambodiaCameroonCanadaCaribbean small statesCentral African RepublicCentral Europe and the BalticsChadChannel IslandsChileChinaColombiaComorosCongo, Dem. Rep.Congo, Rep.Costa RicaCote d'IvoireCroatiaCubaCyprusCzech RepublicDenmarkDjiboutiDominicaDominican RepublicEarly-demographic dividendEast Asia & PacificEast Asia & Pacific (excluding high income)East Asia & Pacific (IDA & IBRD countries)EcuadorEgypt, Arab Rep.El SalvadorEquatorial GuineaEritreaEstoniaEthiopiaEuro areaEurope & Central AsiaEurope & Central Asia (excluding high income)Europe & Central Asia (IDA & IBRD countries)European UnionFaroe IslandsFijiFinlandFragile and conflict affected situationsFranceFrench PolynesiaGabonGambia, TheGeorgiaGermanyGhanaGreeceGreenlandGrenadaGuatemalaGuineaGuinea-BissauGuyanaHaitiHeavily indebted poor countries (HIPC)High incomeHondurasHong Kong SAR, ChinaHungaryIBRD onlyIcelandIDA & IBRD totalIDA blendIDA onlyIDA totalIndiaIndonesiaIran, Islamic Rep.IraqIrelandIsle of ManIsraelItalyJamaicaJapanJordanKazakhstanKenyaKiribatiKorea, Rep.KosovoKuwaitKyrgyz RepublicLao PDRLate-demographic dividendLatin America & Caribbean Latin America & Caribbean (excluding high income)Latin America & the Caribbean (IDA & IBRD countries)LatviaLeast developed countries: UN classificationLebanonLesothoLiberiaLibyaLiechtensteinLithuaniaLow & middle incomeLow incomeLower middle incomeLuxembourgMacao SAR, ChinaMacedonia, FYRMadagascarMalawiMalaysiaMaldivesMaliMaltaMarshall IslandsMauritaniaMauritiusMexicoMicronesia, Fed. Sts.Middle East & North AfricaMiddle East & North Africa (excluding high income)Middle East & North Africa (IDA & IBRD countries)Middle incomeMoldovaMonacoMongoliaMontenegroMoroccoMozambiqueMyanmarNamibiaNepalNetherlandsNew CaledoniaNew ZealandNicaraguaNigerNigeriaNorth AmericaNorwayOECD membersOmanOther small statesPacific island small statesPakistanPalauPanamaPapua New GuineaParaguayPeruPhilippinesPolandPortugalPost-demographic dividendPre-demographic dividendPuerto RicoQatarRomaniaRussian FederationRwandaSamoaSan MarinoSao Tome and PrincipeSaudi ArabiaSenegalSerbiaSeychellesSierra LeoneSingaporeSlovak RepublicSloveniaSmall statesSolomon IslandsSomaliaSouth AfricaSouth AsiaSouth Asia (IDA & IBRD)South SudanSpainSri LankaSt. Kitts and NevisSt. LuciaSt. Vincent and the GrenadinesSub-Saharan Africa Sub-Saharan Africa (excluding high income)Sub-Saharan Africa (IDA & IBRD countries)SudanSurinameSwazilandSwedenSwitzerlandSyrian Arab RepublicTajikistanTanzaniaThailandTimor-LesteTogoTongaTrinidad and TobagoTunisiaTurkeyTurkmenistanTuvaluUgandaUkraineUnited Arab EmiratesUnited KingdomUnited StatesUpper middle incomeUruguayUzbekistanVanuatuVenezuela, RBVietnamVirgin Islands (U.S.)West Bank and GazaWorldYemen, Rep.ZambiaZimbabwe Timeline:
This timeline shows a graph from 1971 to 2015 of Mexico. No data until 1970. Number of actual observations by date: 45.
Source name:
World Development Indicators
Source organization:
World Bank staff estimates based on sources and methods in World Bank's "The Changing Wealth of Nations: Measuring Sustainable Development in the New Millennium" (2011).
Categories, topics:
Economy & Growth, Energy & Mining, Environment
Last updated:
apr 23, 2017
Indicators value changes by year
At the date of observation
Value
Absolute change
Change from previous value
jan 1, 1971
0.373
+0.373
0.0%
jan 1, 1972
0.443
+0.07
18.85%
jan 1, 1973
0.424
-0.019
-4.27%
jan 1, 1974
0.533
+0.109
25.58%
jan 1, 1975
1.817
+1.284
241.0%
jan 1, 1976
1.711
-0.106
-5.85%
jan 1, 1977
2.095
+0.385
22.49%
jan 1, 1978
2.97
+0.875
41.74%
jan 1, 1979
3.07
+0.1
3.37%
jan 1, 1980
6.54
+3.47
113.03%
jan 1, 1981
7.073
+0.532
8.14%
jan 1, 1982
6.225
-0.848
-11.99%
jan 1, 1983
9.715
+3.491
56.08%
jan 1, 1984
9.682
-0.034
-0.35%
jan 1, 1985
7.898
-1.784
-18.42%
jan 1, 1986
6.68
-1.218
-15.42%
jan 1, 1987
4.274
-2.407
-36.02%
jan 1, 1988
5.34
+1.066
24.94%
jan 1, 1989
3.065
-2.275
-42.6%
jan 1, 1990
3.137
+0.072
2.34%
jan 1, 1991
3.661
+0.524
16.71%
jan 1, 1992
2.691
-0.97
-26.49%
jan 1, 1993
2.212
-0.479
-17.8%
jan 1, 1994
1.435
-0.777
-35.13%
jan 1, 1995
1.298
-0.137
-9.58%
jan 1, 1996
2.156
+0.859
66.17%
jan 1, 1997
2.517
+0.36
16.71%
jan 1, 1998
2.102
-0.415
-16.49%
jan 1, 1999
1.758
-0.343
-16.33%
jan 1, 2000
2.025
+0.267
15.17%
jan 1, 2001
3.355
+1.33
65.66%
jan 1, 2002
2.807
-0.548
-16.33%
jan 1, 2003
2.832
+0.024
0.87%
jan 1, 2004
4.046
+1.215
42.89%
jan 1, 2005
5.105
+1.059
26.16%
jan 1, 2006
6.998
+1.893
37.09%
jan 1, 2007
7.331
+0.333
4.75%
jan 1, 2008
6.927
-0.404
-5.51%
jan 1, 2009
8.261
+1.334
19.26%
jan 1, 2010
5.276
-2.985
-36.14%
jan 1, 2011
5.542
+0.267
5.06%
jan 1, 2012
6.524
+0.982
17.72%
jan 1, 2013
6.191
-0.333
-5.11%
jan 1, 2014
5.628
-0.563
-9.09%
jan 1, 2015
4.364
-1.264
-22.46%
Ranking of countries by current statistics by years


Comments: