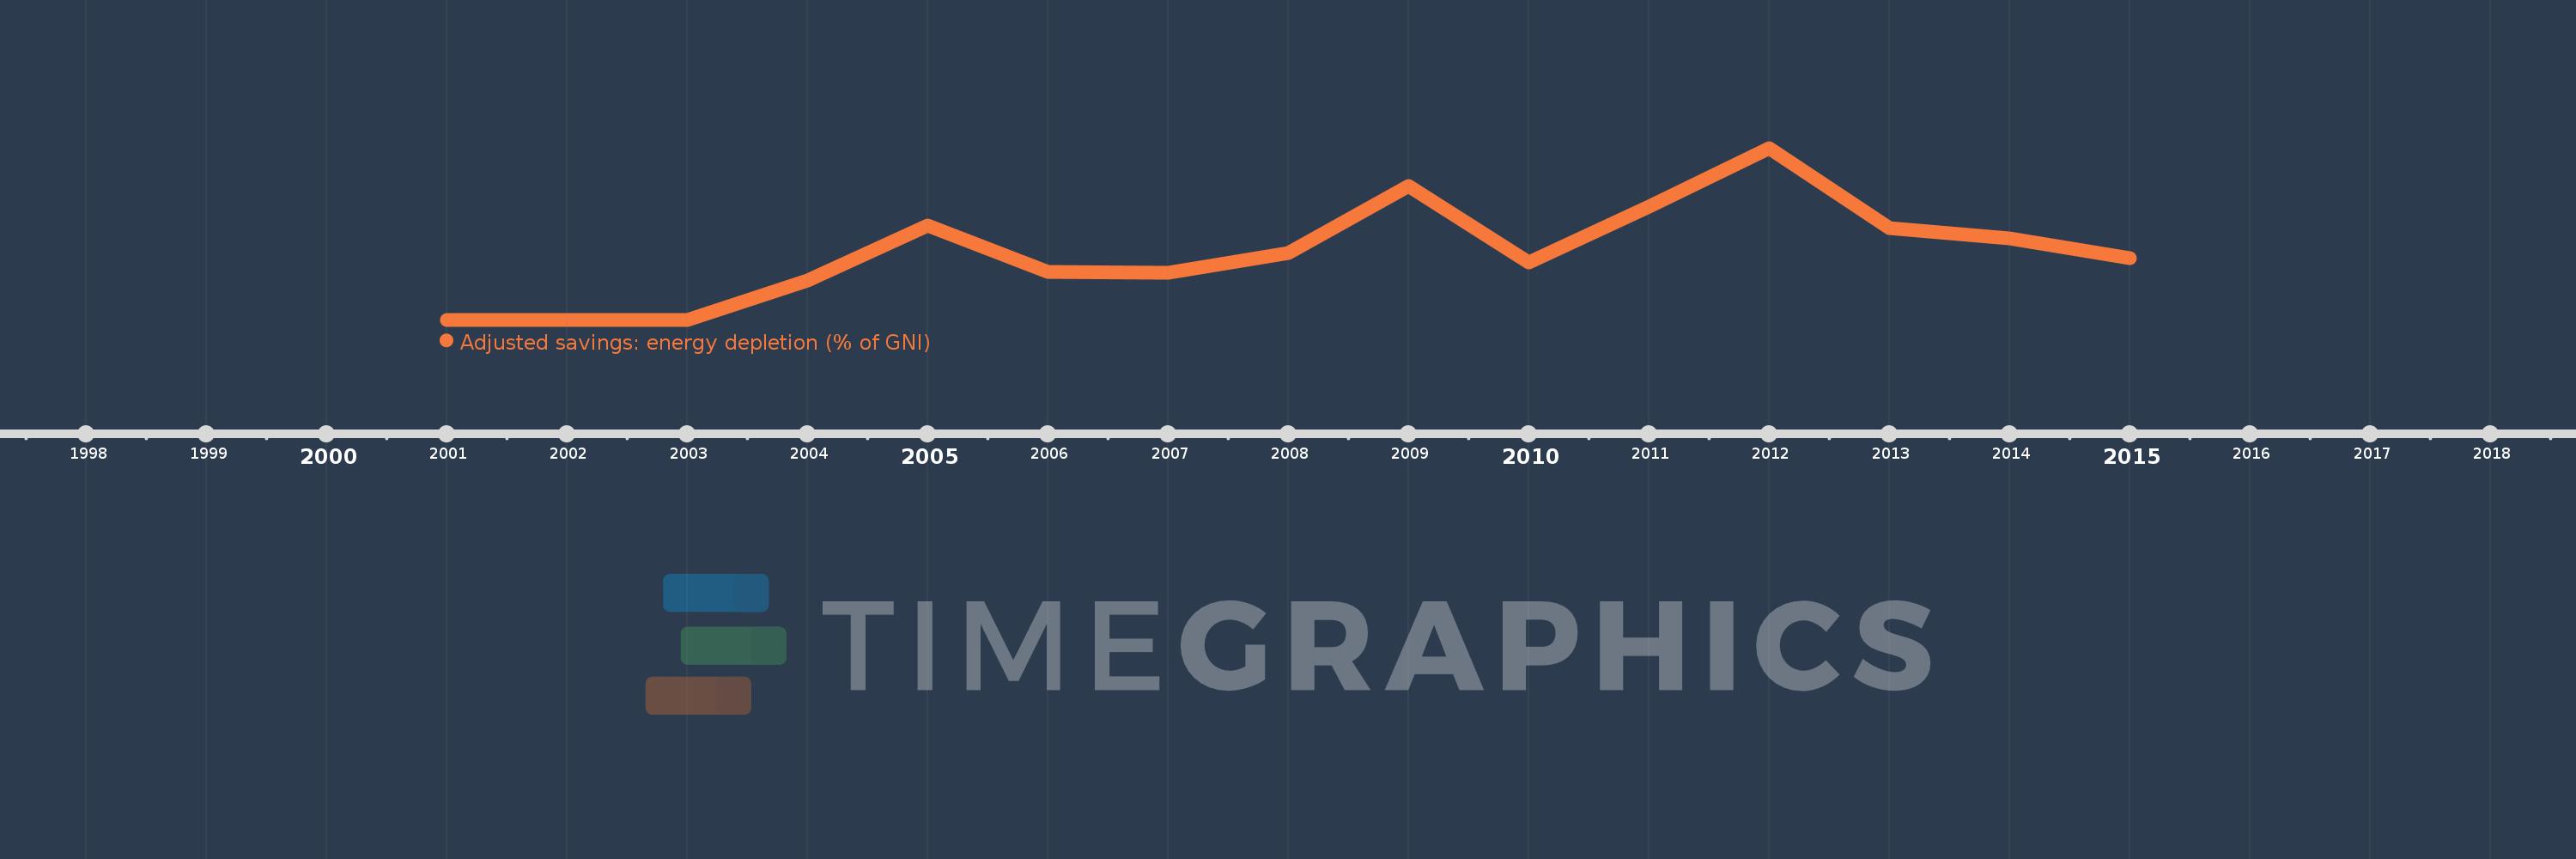
This timeline shows a graph from 2001 to 2015 of Estonia. No data until 2000. Number of actual observations by date: 15.
Source name:
World Development Indicators
Source organization:
World Bank staff estimates based on sources and methods in World Bank's "The Changing Wealth of Nations: Measuring Sustainable Development in the New Millennium" (2011).
Categories, topics:
Economy & Growth, Energy & Mining, Environment
Last updated:
apr 23, 2017
Indicators value changes by year
Meaning:
0.258
Minimum:
0.0
jan 1, 2001
Maximum:
0.662
jan 1, 2012
At the date of observation
Value
Absolute change
Change from the previous value
jan 1, 2001
0.0
0.0
0.0%
jan 1, 2002
0.0
0.0
%
jan 1, 2003
0.0
0.0
%
jan 1, 2004
0.15
+0.15
%
jan 1, 2005
0.363
+0.213
142.12%
jan 1, 2006
0.185
-0.177
-48.87%
jan 1, 2007
0.182
-0.003
-1.64%
jan 1, 2008
0.258
+0.076
41.71%
jan 1, 2009
0.516
+0.258
99.84%
jan 1, 2010
0.22
-0.297
-57.48%
jan 1, 2011
0.436
+0.216
98.35%
jan 1, 2012
0.662
+0.227
52.02%
jan 1, 2013
0.354
-0.308
-46.49%
jan 1, 2014
0.312
-0.042
-11.97%
jan 1, 2015
0.237
-0.075
-24.14%
Ranking of countries by current statistics by years
