29
/
en
AIzaSyAYiBZKx7MnpbEhh9jyipgxe19OcubqV5w
April 1, 2024
118607
Denmark
DNK
true
2
1
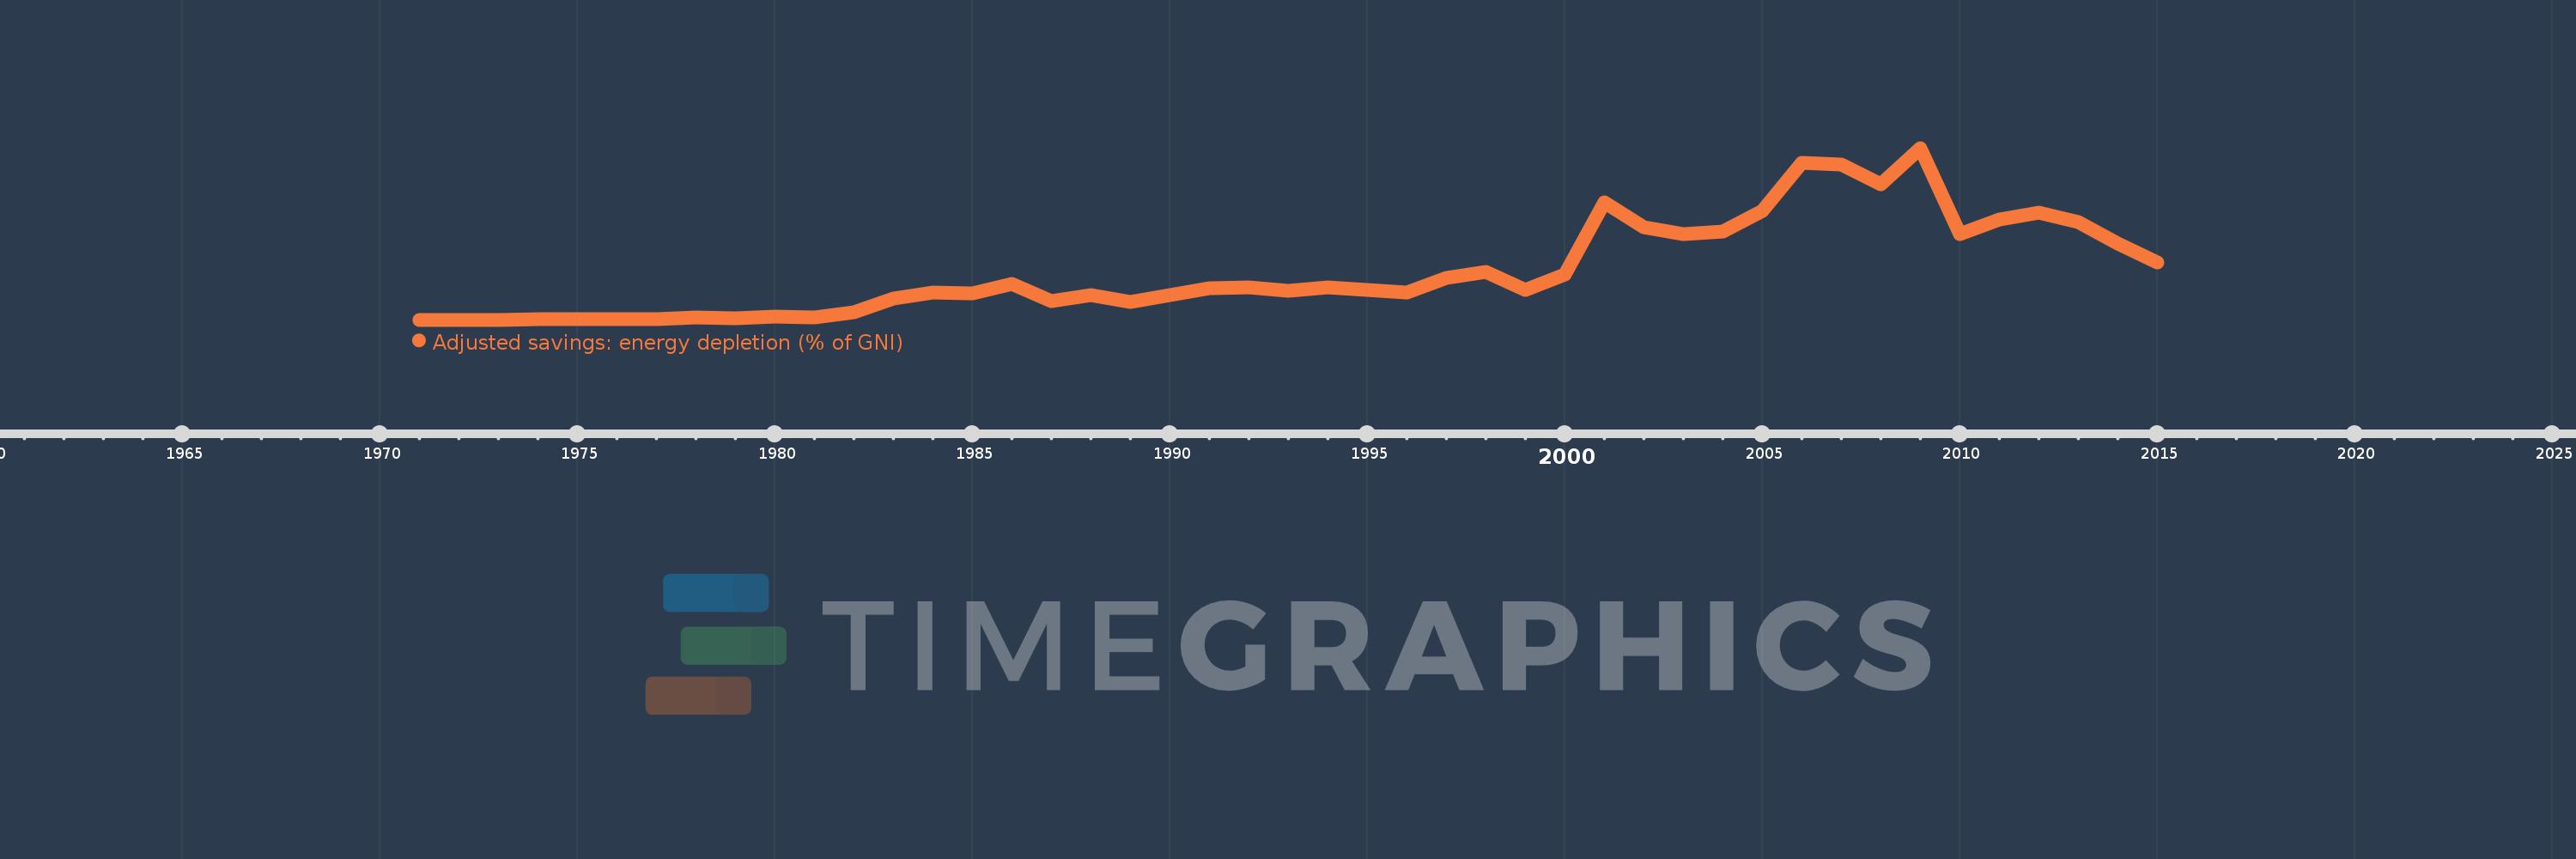
Adjusted savings: energy depletion (% of GNI)
2015,2014,2013,2012,2011,2010,2009,2008,2007,2006,2005,2004,2003,2002,2001,2000,1999,1998,1997,1996,1995,1994,1993,1992,1991,1990,1989,1988,1987,1986,1985,1984,1983,1982,1981,1980,1979,1978,1977,1976,1975,1974,1973,1972,1971
This statistics in other country:
AfghanistanAlbaniaAlgeriaAmerican SamoaAndorraAngolaAntigua and BarbudaArab WorldArgentinaArmeniaAustraliaAustriaAzerbaijanBahamas, TheBahrainBangladeshBarbadosBelarusBelgiumBelizeBeninBermudaBhutanBoliviaBosnia and HerzegovinaBotswanaBrazilBrunei DarussalamBulgariaBurkina FasoBurundiCabo VerdeCambodiaCameroonCanadaCaribbean small statesCentral African RepublicCentral Europe and the BalticsChadChannel IslandsChileChinaColombiaComorosCongo, Dem. Rep.Congo, Rep.Costa RicaCote d'IvoireCroatiaCubaCyprusCzech RepublicDenmarkDjiboutiDominicaDominican RepublicEarly-demographic dividendEast Asia & PacificEast Asia & Pacific (excluding high income)East Asia & Pacific (IDA & IBRD countries)EcuadorEgypt, Arab Rep.El SalvadorEquatorial GuineaEritreaEstoniaEthiopiaEuro areaEurope & Central AsiaEurope & Central Asia (excluding high income)Europe & Central Asia (IDA & IBRD countries)European UnionFaroe IslandsFijiFinlandFragile and conflict affected situationsFranceFrench PolynesiaGabonGambia, TheGeorgiaGermanyGhanaGreeceGreenlandGrenadaGuatemalaGuineaGuinea-BissauGuyanaHaitiHeavily indebted poor countries (HIPC)High incomeHondurasHong Kong SAR, ChinaHungaryIBRD onlyIcelandIDA & IBRD totalIDA blendIDA onlyIDA totalIndiaIndonesiaIran, Islamic Rep.IraqIrelandIsle of ManIsraelItalyJamaicaJapanJordanKazakhstanKenyaKiribatiKorea, Rep.KosovoKuwaitKyrgyz RepublicLao PDRLate-demographic dividendLatin America & Caribbean Latin America & Caribbean (excluding high income)Latin America & the Caribbean (IDA & IBRD countries)LatviaLeast developed countries: UN classificationLebanonLesothoLiberiaLibyaLiechtensteinLithuaniaLow & middle incomeLow incomeLower middle incomeLuxembourgMacao SAR, ChinaMacedonia, FYRMadagascarMalawiMalaysiaMaldivesMaliMaltaMarshall IslandsMauritaniaMauritiusMexicoMicronesia, Fed. Sts.Middle East & North AfricaMiddle East & North Africa (excluding high income)Middle East & North Africa (IDA & IBRD countries)Middle incomeMoldovaMonacoMongoliaMontenegroMoroccoMozambiqueMyanmarNamibiaNepalNetherlandsNew CaledoniaNew ZealandNicaraguaNigerNigeriaNorth AmericaNorwayOECD membersOmanOther small statesPacific island small statesPakistanPalauPanamaPapua New GuineaParaguayPeruPhilippinesPolandPortugalPost-demographic dividendPre-demographic dividendPuerto RicoQatarRomaniaRussian FederationRwandaSamoaSan MarinoSao Tome and PrincipeSaudi ArabiaSenegalSerbiaSeychellesSierra LeoneSingaporeSlovak RepublicSloveniaSmall statesSolomon IslandsSomaliaSouth AfricaSouth AsiaSouth Asia (IDA & IBRD)South SudanSpainSri LankaSt. Kitts and NevisSt. LuciaSt. Vincent and the GrenadinesSub-Saharan Africa Sub-Saharan Africa (excluding high income)Sub-Saharan Africa (IDA & IBRD countries)SudanSurinameSwazilandSwedenSwitzerlandSyrian Arab RepublicTajikistanTanzaniaThailandTimor-LesteTogoTongaTrinidad and TobagoTunisiaTurkeyTurkmenistanTuvaluUgandaUkraineUnited Arab EmiratesUnited KingdomUnited StatesUpper middle incomeUruguayUzbekistanVanuatuVenezuela, RBVietnamVirgin Islands (U.S.)West Bank and GazaWorldYemen, Rep.ZambiaZimbabwe Timeline:
This timeline shows a graph from 1971 to 2015 of Denmark. No data until 1970. Number of actual observations by date: 45.
Source name:
World Development Indicators
Source organization:
World Bank staff estimates based on sources and methods in World Bank's "The Changing Wealth of Nations: Measuring Sustainable Development in the New Millennium" (2011).
Categories, topics:
Economy & Growth, Energy & Mining, Environment
Last updated:
apr 23, 2017
Indicators value changes by year
At the date of observation
Value
Absolute change
Change from previous value
jan 1, 1973
0.002
+0.002
%
jan 1, 1974
0.004
+0.002
78.78%
jan 1, 1975
0.01
+0.006
148.99%
jan 1, 1976
0.012
+0.002
18.22%
jan 1, 1977
0.016
+0.004
35.53%
jan 1, 1978
0.039
+0.023
140.15%
jan 1, 1979
0.026
-0.013
-32.66%
jan 1, 1980
0.056
+0.03
113.36%
jan 1, 1981
0.048
-0.007
-13.34%
jan 1, 1982
0.133
+0.084
175.15%
jan 1, 1983
0.383
+0.251
189.25%
jan 1, 1984
0.478
+0.094
24.6%
jan 1, 1985
0.472
-0.006
-1.26%
jan 1, 1986
0.634
+0.162
34.32%
jan 1, 1987
0.339
-0.295
-46.5%
jan 1, 1988
0.441
+0.102
29.95%
jan 1, 1989
0.312
-0.129
-29.23%
jan 1, 1990
0.447
+0.135
43.45%
jan 1, 1991
0.561
+0.114
25.46%
jan 1, 1992
0.58
+0.019
3.36%
jan 1, 1993
0.521
-0.059
-10.11%
jan 1, 1994
0.572
+0.05
9.69%
jan 1, 1995
0.533
-0.039
-6.81%
jan 1, 1996
0.489
-0.044
-8.27%
jan 1, 1997
0.738
+0.249
50.98%
jan 1, 1998
0.855
+0.117
15.82%
jan 1, 1999
0.531
-0.324
-37.88%
jan 1, 2000
0.807
+0.276
52.01%
jan 1, 2001
2.092
+1.284
159.15%
jan 1, 2002
1.652
-0.44
-21.02%
jan 1, 2003
1.528
-0.123
-7.47%
jan 1, 2004
1.575
+0.046
3.01%
jan 1, 2005
1.937
+0.362
23.0%
jan 1, 2006
2.797
+0.86
44.43%
jan 1, 2007
2.76
-0.037
-1.32%
jan 1, 2008
2.409
-0.351
-12.72%
jan 1, 2009
3.062
+0.653
27.11%
jan 1, 2010
1.526
-1.537
-50.18%
jan 1, 2011
1.78
+0.254
16.65%
jan 1, 2012
1.911
+0.132
7.39%
jan 1, 2013
1.742
-0.169
-8.83%
jan 1, 2014
1.351
-0.391
-22.47%
jan 1, 2015
1.023
-0.328
-24.28%
Ranking of countries by current statistics by years


Comments: