29
/
en
AIzaSyAYiBZKx7MnpbEhh9jyipgxe19OcubqV5w
April 1, 2024
39679
IDA total
IDA
false
2
1
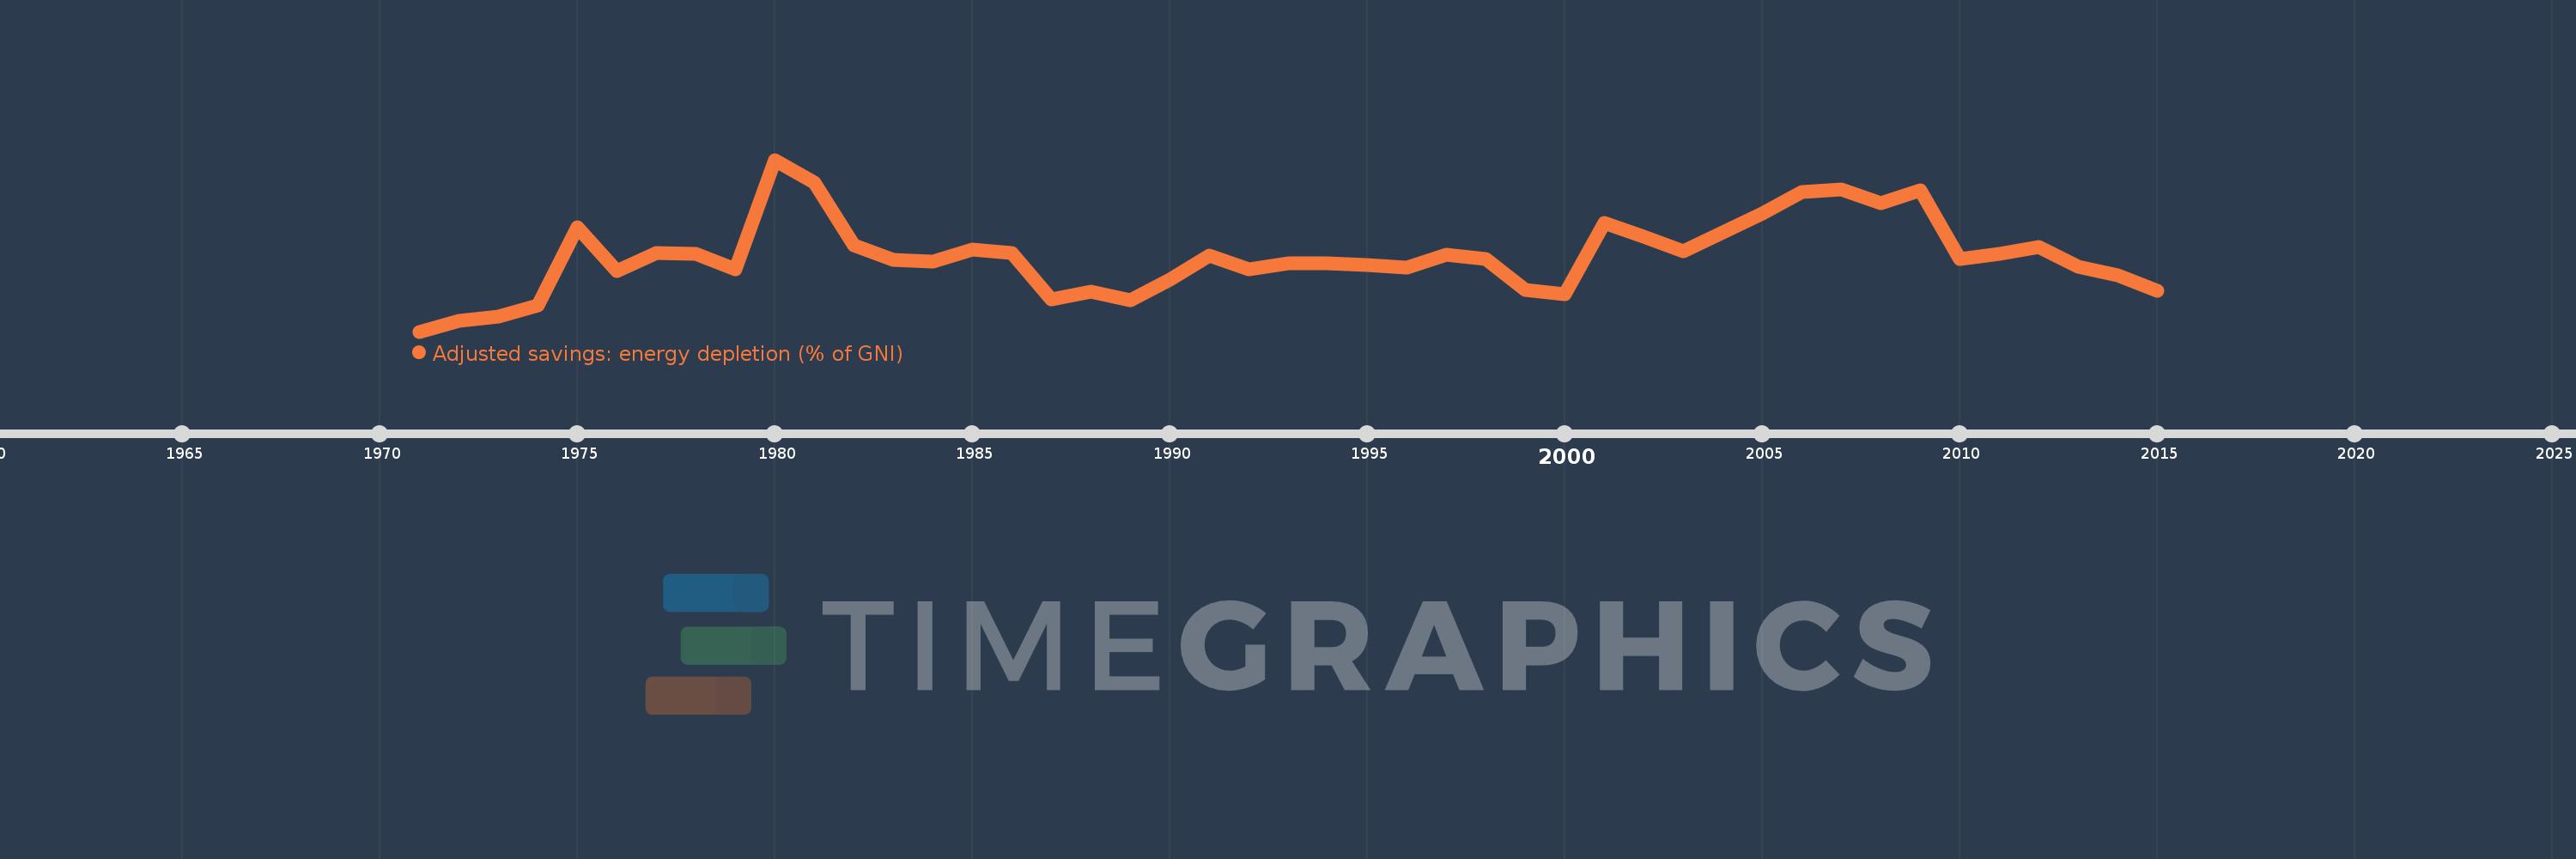
Adjusted savings: energy depletion (% of GNI)
2015,2014,2013,2012,2011,2010,2009,2008,2007,2006,2005,2004,2003,2002,2001,2000,1999,1998,1997,1996,1995,1994,1993,1992,1991,1990,1989,1988,1987,1986,1985,1984,1983,1982,1981,1980,1979,1978,1977,1976,1975,1974,1973,1972,1971
This statistics in other country:
AfghanistanAlbaniaAlgeriaAmerican SamoaAndorraAngolaAntigua and BarbudaArab WorldArgentinaArmeniaAustraliaAustriaAzerbaijanBahamas, TheBahrainBangladeshBarbadosBelarusBelgiumBelizeBeninBermudaBhutanBoliviaBosnia and HerzegovinaBotswanaBrazilBrunei DarussalamBulgariaBurkina FasoBurundiCabo VerdeCambodiaCameroonCanadaCaribbean small statesCentral African RepublicCentral Europe and the BalticsChadChannel IslandsChileChinaColombiaComorosCongo, Dem. Rep.Congo, Rep.Costa RicaCote d'IvoireCroatiaCubaCyprusCzech RepublicDenmarkDjiboutiDominicaDominican RepublicEarly-demographic dividendEast Asia & PacificEast Asia & Pacific (excluding high income)East Asia & Pacific (IDA & IBRD countries)EcuadorEgypt, Arab Rep.El SalvadorEquatorial GuineaEritreaEstoniaEthiopiaEuro areaEurope & Central AsiaEurope & Central Asia (excluding high income)Europe & Central Asia (IDA & IBRD countries)European UnionFaroe IslandsFijiFinlandFragile and conflict affected situationsFranceFrench PolynesiaGabonGambia, TheGeorgiaGermanyGhanaGreeceGreenlandGrenadaGuatemalaGuineaGuinea-BissauGuyanaHaitiHeavily indebted poor countries (HIPC)High incomeHondurasHong Kong SAR, ChinaHungaryIBRD onlyIcelandIDA & IBRD totalIDA blendIDA onlyIDA totalIndiaIndonesiaIran, Islamic Rep.IraqIrelandIsle of ManIsraelItalyJamaicaJapanJordanKazakhstanKenyaKiribatiKorea, Rep.KosovoKuwaitKyrgyz RepublicLao PDRLate-demographic dividendLatin America & Caribbean Latin America & Caribbean (excluding high income)Latin America & the Caribbean (IDA & IBRD countries)LatviaLeast developed countries: UN classificationLebanonLesothoLiberiaLibyaLiechtensteinLithuaniaLow & middle incomeLow incomeLower middle incomeLuxembourgMacao SAR, ChinaMacedonia, FYRMadagascarMalawiMalaysiaMaldivesMaliMaltaMarshall IslandsMauritaniaMauritiusMexicoMicronesia, Fed. Sts.Middle East & North AfricaMiddle East & North Africa (excluding high income)Middle East & North Africa (IDA & IBRD countries)Middle incomeMoldovaMonacoMongoliaMontenegroMoroccoMozambiqueMyanmarNamibiaNepalNetherlandsNew CaledoniaNew ZealandNicaraguaNigerNigeriaNorth AmericaNorwayOECD membersOmanOther small statesPacific island small statesPakistanPalauPanamaPapua New GuineaParaguayPeruPhilippinesPolandPortugalPost-demographic dividendPre-demographic dividendPuerto RicoQatarRomaniaRussian FederationRwandaSamoaSan MarinoSao Tome and PrincipeSaudi ArabiaSenegalSerbiaSeychellesSierra LeoneSingaporeSlovak RepublicSloveniaSmall statesSolomon IslandsSomaliaSouth AfricaSouth AsiaSouth Asia (IDA & IBRD)South SudanSpainSri LankaSt. Kitts and NevisSt. LuciaSt. Vincent and the GrenadinesSub-Saharan Africa Sub-Saharan Africa (excluding high income)Sub-Saharan Africa (IDA & IBRD countries)SudanSurinameSwazilandSwedenSwitzerlandSyrian Arab RepublicTajikistanTanzaniaThailandTimor-LesteTogoTongaTrinidad and TobagoTunisiaTurkeyTurkmenistanTuvaluUgandaUkraineUnited Arab EmiratesUnited KingdomUnited StatesUpper middle incomeUruguayUzbekistanVanuatuVenezuela, RBVietnamVirgin Islands (U.S.)West Bank and GazaWorldYemen, Rep.ZambiaZimbabwe Timeline:
This timeline shows a graph from 1971 to 2015 of IDA total. No data until 1970. Number of actual observations by date: 45.
Source name:
World Development Indicators
Source organization:
World Bank staff estimates based on sources and methods in World Bank's "The Changing Wealth of Nations: Measuring Sustainable Development in the New Millennium" (2011).
Categories, topics:
Economy & Growth, Energy & Mining, Environment
Last updated:
apr 23, 2017
Indicators value changes by year
Maximum:
11.347
jan 1, 1980
At the date of observation
Value
Absolute change
Change from previous value
jan 1, 1971
0.514
+0.514
0.0%
jan 1, 1972
1.206
+0.691
134.5%
jan 1, 1973
1.475
+0.269
22.32%
jan 1, 1974
2.183
+0.708
48.02%
jan 1, 1975
7.121
+4.938
226.23%
jan 1, 1976
4.34
-2.781
-39.05%
jan 1, 1977
5.487
+1.146
26.41%
jan 1, 1978
5.433
-0.054
-0.98%
jan 1, 1979
4.462
-0.971
-17.87%
jan 1, 1980
11.347
+6.884
154.26%
jan 1, 1981
9.925
-1.422
-12.53%
jan 1, 1982
5.957
-3.968
-39.98%
jan 1, 1983
5.042
-0.914
-15.35%
jan 1, 1984
4.942
-0.1
-1.98%
jan 1, 1985
5.665
+0.723
14.63%
jan 1, 1986
5.463
-0.202
-3.57%
jan 1, 1987
2.559
-2.905
-53.17%
jan 1, 1988
3.049
+0.491
19.18%
jan 1, 1989
2.493
-0.556
-18.23%
jan 1, 1990
3.818
+1.325
53.12%
jan 1, 1991
5.331
+1.513
39.63%
jan 1, 1992
4.449
-0.882
-16.55%
jan 1, 1993
4.841
+0.392
8.82%
jan 1, 1994
4.832
-0.008
-0.18%
jan 1, 1995
4.737
-0.095
-1.98%
jan 1, 1996
4.551
-0.186
-3.92%
jan 1, 1997
5.376
+0.825
18.13%
jan 1, 1998
5.095
-0.281
-5.23%
jan 1, 1999
3.141
-1.954
-38.36%
jan 1, 2000
2.852
-0.288
-9.18%
jan 1, 2001
7.351
+4.499
157.73%
jan 1, 2002
6.525
-0.827
-11.24%
jan 1, 2003
5.559
-0.965
-14.8%
jan 1, 2004
6.745
+1.185
21.32%
jan 1, 2005
7.986
+1.241
18.41%
jan 1, 2006
9.292
+1.306
16.35%
jan 1, 2007
9.503
+0.211
2.27%
jan 1, 2008
8.597
-0.906
-9.53%
jan 1, 2009
9.413
+0.816
9.49%
jan 1, 2010
5.113
-4.3
-45.68%
jan 1, 2011
5.434
+0.321
6.27%
jan 1, 2012
5.853
+0.42
7.72%
jan 1, 2013
4.589
-1.264
-21.6%
jan 1, 2014
4.055
-0.534
-11.64%
jan 1, 2015
3.079
-0.976
-24.08%
Ranking of countries by current statistics by years


Comments: