29
/
en
AIzaSyAYiBZKx7MnpbEhh9jyipgxe19OcubqV5w
April 1, 2024
266507
Trinidad and Tobago
TTO
true
2
1
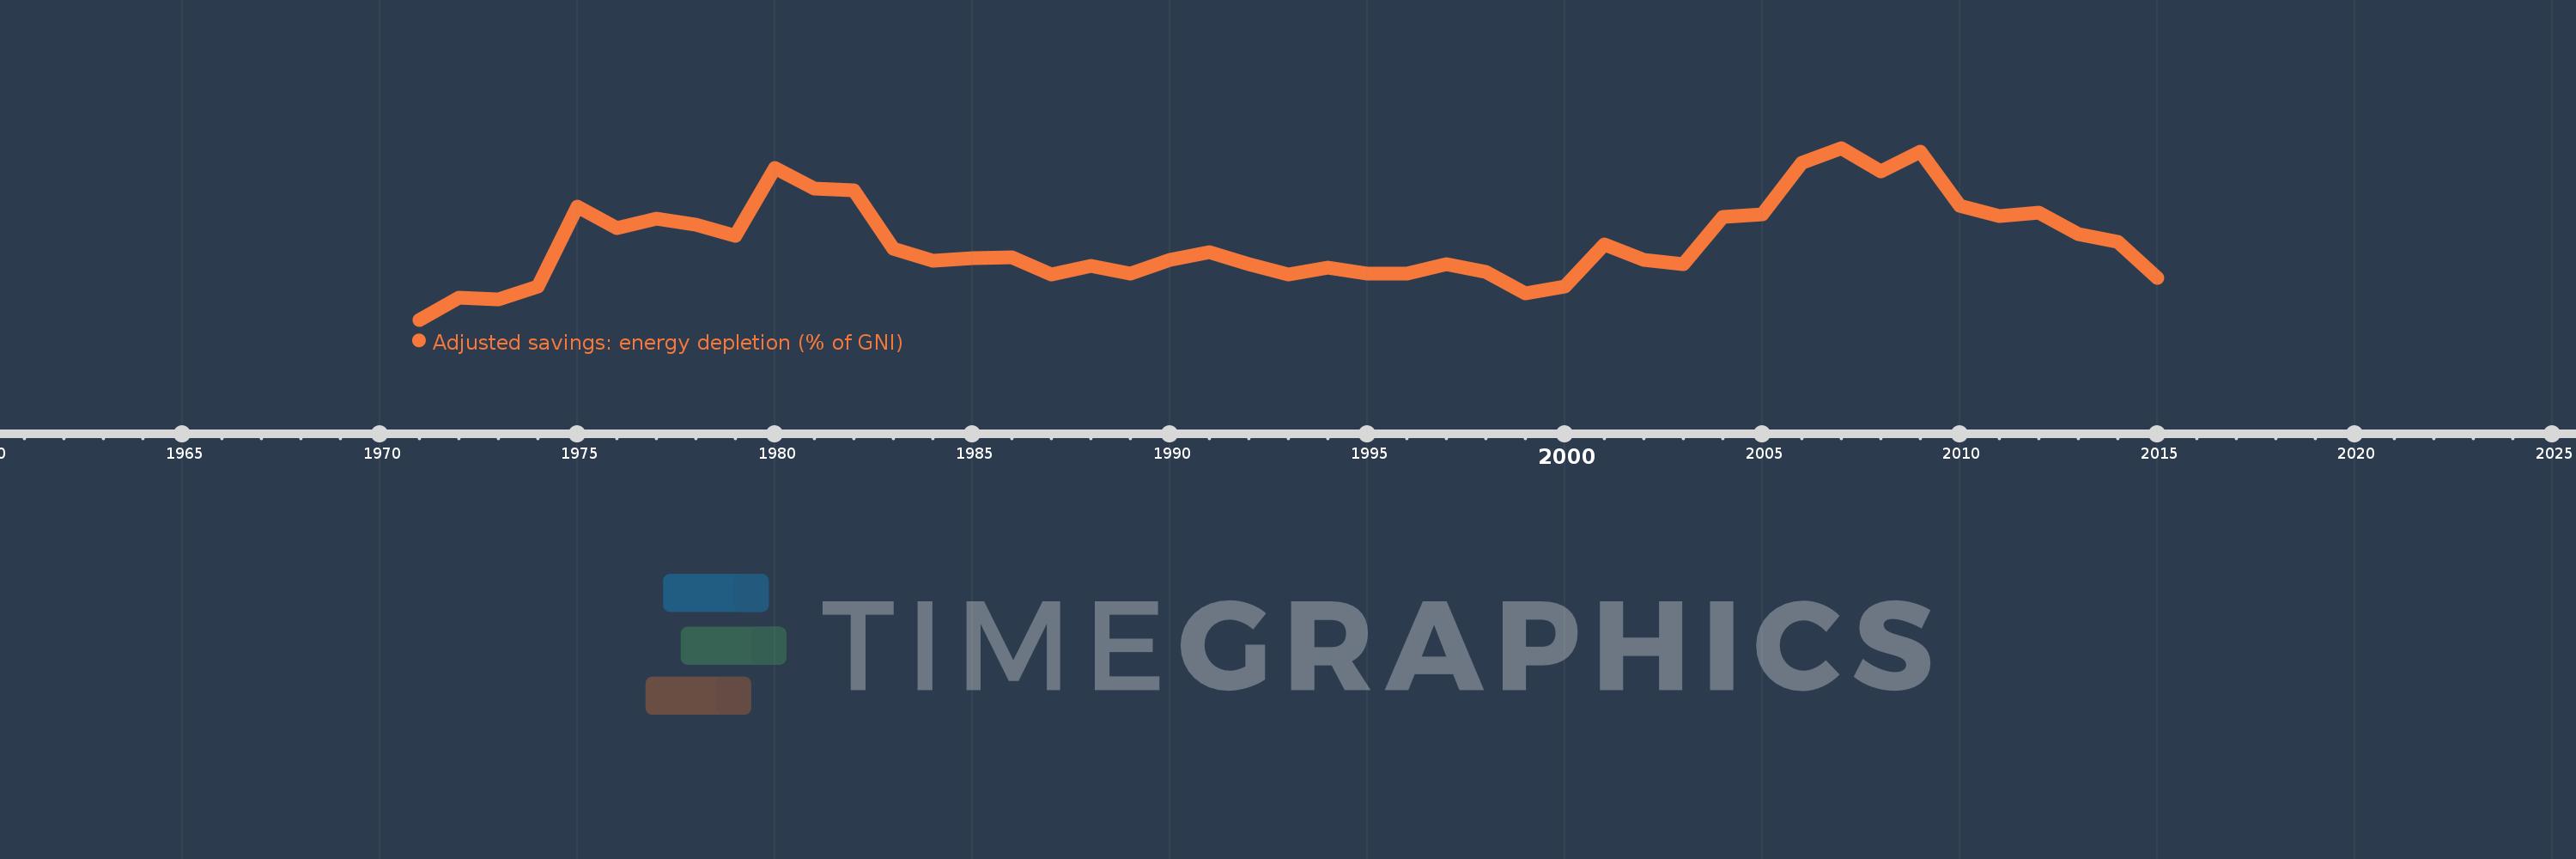
Adjusted savings: energy depletion (% of GNI)
2015,2014,2013,2012,2011,2010,2009,2008,2007,2006,2005,2004,2003,2002,2001,2000,1999,1998,1997,1996,1995,1994,1993,1992,1991,1990,1989,1988,1987,1986,1985,1984,1983,1982,1981,1980,1979,1978,1977,1976,1975,1974,1973,1972,1971
This statistics in other country:
AfghanistanAlbaniaAlgeriaAmerican SamoaAndorraAngolaAntigua and BarbudaArab WorldArgentinaArmeniaAustraliaAustriaAzerbaijanBahamas, TheBahrainBangladeshBarbadosBelarusBelgiumBelizeBeninBermudaBhutanBoliviaBosnia and HerzegovinaBotswanaBrazilBrunei DarussalamBulgariaBurkina FasoBurundiCabo VerdeCambodiaCameroonCanadaCaribbean small statesCentral African RepublicCentral Europe and the BalticsChadChannel IslandsChileChinaColombiaComorosCongo, Dem. Rep.Congo, Rep.Costa RicaCote d'IvoireCroatiaCubaCyprusCzech RepublicDenmarkDjiboutiDominicaDominican RepublicEarly-demographic dividendEast Asia & PacificEast Asia & Pacific (excluding high income)East Asia & Pacific (IDA & IBRD countries)EcuadorEgypt, Arab Rep.El SalvadorEquatorial GuineaEritreaEstoniaEthiopiaEuro areaEurope & Central AsiaEurope & Central Asia (excluding high income)Europe & Central Asia (IDA & IBRD countries)European UnionFaroe IslandsFijiFinlandFragile and conflict affected situationsFranceFrench PolynesiaGabonGambia, TheGeorgiaGermanyGhanaGreeceGreenlandGrenadaGuatemalaGuineaGuinea-BissauGuyanaHaitiHeavily indebted poor countries (HIPC)High incomeHondurasHong Kong SAR, ChinaHungaryIBRD onlyIcelandIDA & IBRD totalIDA blendIDA onlyIDA totalIndiaIndonesiaIran, Islamic Rep.IraqIrelandIsle of ManIsraelItalyJamaicaJapanJordanKazakhstanKenyaKiribatiKorea, Rep.KosovoKuwaitKyrgyz RepublicLao PDRLate-demographic dividendLatin America & Caribbean Latin America & Caribbean (excluding high income)Latin America & the Caribbean (IDA & IBRD countries)LatviaLeast developed countries: UN classificationLebanonLesothoLiberiaLibyaLiechtensteinLithuaniaLow & middle incomeLow incomeLower middle incomeLuxembourgMacao SAR, ChinaMacedonia, FYRMadagascarMalawiMalaysiaMaldivesMaliMaltaMarshall IslandsMauritaniaMauritiusMexicoMicronesia, Fed. Sts.Middle East & North AfricaMiddle East & North Africa (excluding high income)Middle East & North Africa (IDA & IBRD countries)Middle incomeMoldovaMonacoMongoliaMontenegroMoroccoMozambiqueMyanmarNamibiaNepalNetherlandsNew CaledoniaNew ZealandNicaraguaNigerNigeriaNorth AmericaNorwayOECD membersOmanOther small statesPacific island small statesPakistanPalauPanamaPapua New GuineaParaguayPeruPhilippinesPolandPortugalPost-demographic dividendPre-demographic dividendPuerto RicoQatarRomaniaRussian FederationRwandaSamoaSan MarinoSao Tome and PrincipeSaudi ArabiaSenegalSerbiaSeychellesSierra LeoneSingaporeSlovak RepublicSloveniaSmall statesSolomon IslandsSomaliaSouth AfricaSouth AsiaSouth Asia (IDA & IBRD)South SudanSpainSri LankaSt. Kitts and NevisSt. LuciaSt. Vincent and the GrenadinesSub-Saharan Africa Sub-Saharan Africa (excluding high income)Sub-Saharan Africa (IDA & IBRD countries)SudanSurinameSwazilandSwedenSwitzerlandSyrian Arab RepublicTajikistanTanzaniaThailandTimor-LesteTogoTongaTrinidad and TobagoTunisiaTurkeyTurkmenistanTuvaluUgandaUkraineUnited Arab EmiratesUnited KingdomUnited StatesUpper middle incomeUruguayUzbekistanVanuatuVenezuela, RBVietnamVirgin Islands (U.S.)West Bank and GazaWorldYemen, Rep.ZambiaZimbabwe Timeline:
This timeline shows a graph from 1971 to 2015 of Trinidad and Tobago. No data until 1970. Number of actual observations by date: 45.
Source name:
World Development Indicators
Source organization:
World Bank staff estimates based on sources and methods in World Bank's "The Changing Wealth of Nations: Measuring Sustainable Development in the New Millennium" (2011).
Categories, topics:
Economy & Growth, Energy & Mining, Environment
Last updated:
apr 23, 2017
Indicators value changes by year
Maximum:
52.129
jan 1, 2007
At the date of observation
Value
Absolute change
Change from previous value
jan 1, 1971
1.058
+1.058
0.0%
jan 1, 1972
7.57
+6.512
615.43%
jan 1, 1973
7.198
-0.371
-4.91%
jan 1, 1974
10.957
+3.758
52.21%
jan 1, 1975
34.664
+23.707
216.37%
jan 1, 1976
28.343
-6.321
-18.23%
jan 1, 1977
30.996
+2.653
9.36%
jan 1, 1978
29.436
-1.56
-5.03%
jan 1, 1979
25.983
-3.454
-11.73%
jan 1, 1980
46.088
+20.106
77.38%
jan 1, 1981
40.093
-5.995
-13.01%
jan 1, 1982
39.476
-0.617
-1.54%
jan 1, 1983
22.153
-17.323
-43.88%
jan 1, 1984
18.496
-3.656
-16.51%
jan 1, 1985
19.447
+0.951
5.14%
jan 1, 1986
19.671
+0.224
1.15%
jan 1, 1987
14.613
-5.057
-25.71%
jan 1, 1988
17.058
+2.445
16.73%
jan 1, 1989
14.662
-2.396
-14.05%
jan 1, 1990
18.753
+4.091
27.9%
jan 1, 1991
21.136
+2.383
12.7%
jan 1, 1992
17.619
-3.517
-16.64%
jan 1, 1993
14.638
-2.981
-16.92%
jan 1, 1994
16.533
+1.895
12.94%
jan 1, 1995
14.77
-1.763
-10.66%
jan 1, 1996
14.649
-0.12
-0.82%
jan 1, 1997
17.537
+2.887
19.71%
jan 1, 1998
15.331
-2.206
-12.58%
jan 1, 1999
9.017
-6.314
-41.18%
jan 1, 2000
10.893
+1.876
20.8%
jan 1, 2001
23.409
+12.516
114.9%
jan 1, 2002
18.825
-4.584
-19.58%
jan 1, 2003
17.662
-1.162
-6.17%
jan 1, 2004
31.504
+13.842
78.37%
jan 1, 2005
32.38
+0.875
2.78%
jan 1, 2006
47.673
+15.294
47.23%
jan 1, 2007
52.129
+4.455
9.35%
jan 1, 2008
45.245
-6.884
-13.21%
jan 1, 2009
50.948
+5.704
12.61%
jan 1, 2010
34.989
-15.959
-31.32%
jan 1, 2011
31.967
-3.022
-8.64%
jan 1, 2012
32.778
+0.812
2.54%
jan 1, 2013
26.512
-6.267
-19.12%
jan 1, 2014
24.262
-2.25
-8.49%
jan 1, 2015
13.383
-10.879
-44.84%
Ranking of countries by current statistics by years


Comments: