29
/
en
AIzaSyAYiBZKx7MnpbEhh9jyipgxe19OcubqV5w
April 1, 2024
61316
Upper middle income
UMC
false
2
1
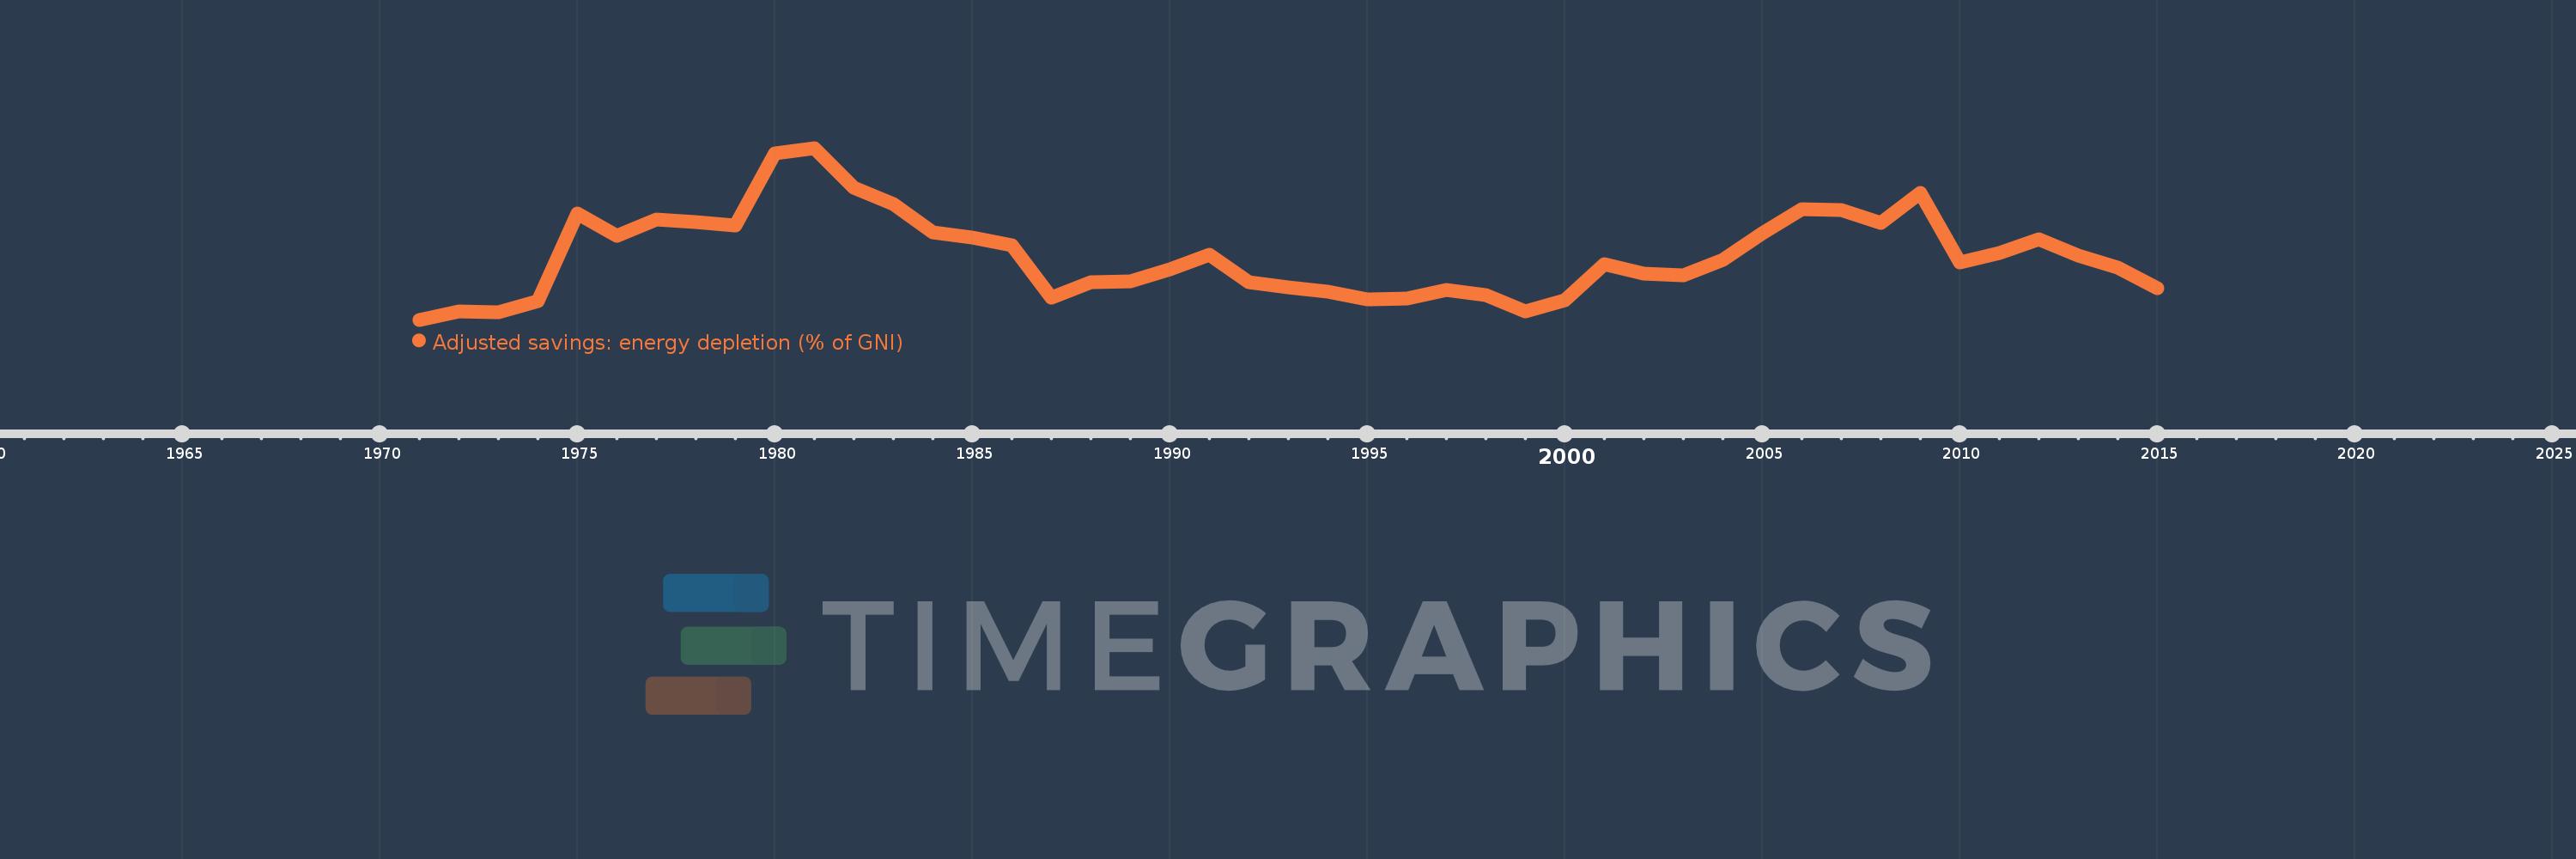
Adjusted savings: energy depletion (% of GNI)
2015,2014,2013,2012,2011,2010,2009,2008,2007,2006,2005,2004,2003,2002,2001,2000,1999,1998,1997,1996,1995,1994,1993,1992,1991,1990,1989,1988,1987,1986,1985,1984,1983,1982,1981,1980,1979,1978,1977,1976,1975,1974,1973,1972,1971
This statistics in other country:
AfghanistanAlbaniaAlgeriaAmerican SamoaAndorraAngolaAntigua and BarbudaArab WorldArgentinaArmeniaAustraliaAustriaAzerbaijanBahamas, TheBahrainBangladeshBarbadosBelarusBelgiumBelizeBeninBermudaBhutanBoliviaBosnia and HerzegovinaBotswanaBrazilBrunei DarussalamBulgariaBurkina FasoBurundiCabo VerdeCambodiaCameroonCanadaCaribbean small statesCentral African RepublicCentral Europe and the BalticsChadChannel IslandsChileChinaColombiaComorosCongo, Dem. Rep.Congo, Rep.Costa RicaCote d'IvoireCroatiaCubaCyprusCzech RepublicDenmarkDjiboutiDominicaDominican RepublicEarly-demographic dividendEast Asia & PacificEast Asia & Pacific (excluding high income)East Asia & Pacific (IDA & IBRD countries)EcuadorEgypt, Arab Rep.El SalvadorEquatorial GuineaEritreaEstoniaEthiopiaEuro areaEurope & Central AsiaEurope & Central Asia (excluding high income)Europe & Central Asia (IDA & IBRD countries)European UnionFaroe IslandsFijiFinlandFragile and conflict affected situationsFranceFrench PolynesiaGabonGambia, TheGeorgiaGermanyGhanaGreeceGreenlandGrenadaGuatemalaGuineaGuinea-BissauGuyanaHaitiHeavily indebted poor countries (HIPC)High incomeHondurasHong Kong SAR, ChinaHungaryIBRD onlyIcelandIDA & IBRD totalIDA blendIDA onlyIDA totalIndiaIndonesiaIran, Islamic Rep.IraqIrelandIsle of ManIsraelItalyJamaicaJapanJordanKazakhstanKenyaKiribatiKorea, Rep.KosovoKuwaitKyrgyz RepublicLao PDRLate-demographic dividendLatin America & Caribbean Latin America & Caribbean (excluding high income)Latin America & the Caribbean (IDA & IBRD countries)LatviaLeast developed countries: UN classificationLebanonLesothoLiberiaLibyaLiechtensteinLithuaniaLow & middle incomeLow incomeLower middle incomeLuxembourgMacao SAR, ChinaMacedonia, FYRMadagascarMalawiMalaysiaMaldivesMaliMaltaMarshall IslandsMauritaniaMauritiusMexicoMicronesia, Fed. Sts.Middle East & North AfricaMiddle East & North Africa (excluding high income)Middle East & North Africa (IDA & IBRD countries)Middle incomeMoldovaMonacoMongoliaMontenegroMoroccoMozambiqueMyanmarNamibiaNepalNetherlandsNew CaledoniaNew ZealandNicaraguaNigerNigeriaNorth AmericaNorwayOECD membersOmanOther small statesPacific island small statesPakistanPalauPanamaPapua New GuineaParaguayPeruPhilippinesPolandPortugalPost-demographic dividendPre-demographic dividendPuerto RicoQatarRomaniaRussian FederationRwandaSamoaSan MarinoSao Tome and PrincipeSaudi ArabiaSenegalSerbiaSeychellesSierra LeoneSingaporeSlovak RepublicSloveniaSmall statesSolomon IslandsSomaliaSouth AfricaSouth AsiaSouth Asia (IDA & IBRD)South SudanSpainSri LankaSt. Kitts and NevisSt. LuciaSt. Vincent and the GrenadinesSub-Saharan Africa Sub-Saharan Africa (excluding high income)Sub-Saharan Africa (IDA & IBRD countries)SudanSurinameSwazilandSwedenSwitzerlandSyrian Arab RepublicTajikistanTanzaniaThailandTimor-LesteTogoTongaTrinidad and TobagoTunisiaTurkeyTurkmenistanTuvaluUgandaUkraineUnited Arab EmiratesUnited KingdomUnited StatesUpper middle incomeUruguayUzbekistanVanuatuVenezuela, RBVietnamVirgin Islands (U.S.)West Bank and GazaWorldYemen, Rep.ZambiaZimbabwe Timeline:
This timeline shows a graph from 1971 to 2015 of Upper middle income. No data until 1970. Number of actual observations by date: 45.
Source name:
World Development Indicators
Source organization:
World Bank staff estimates based on sources and methods in World Bank's "The Changing Wealth of Nations: Measuring Sustainable Development in the New Millennium" (2011).
Categories, topics:
Economy & Growth, Energy & Mining, Environment
Last updated:
apr 23, 2017
Indicators value changes by year
Maximum:
10.664
jan 1, 1981
At the date of observation
Value
Absolute change
Change from previous value
jan 1, 1971
1.257
+1.257
0.0%
jan 1, 1972
1.697
+0.44
35.05%
jan 1, 1973
1.653
-0.045
-2.63%
jan 1, 1974
2.274
+0.621
37.58%
jan 1, 1975
7.058
+4.784
210.37%
jan 1, 1976
5.858
-1.199
-16.99%
jan 1, 1977
6.757
+0.899
15.34%
jan 1, 1978
6.624
-0.133
-1.96%
jan 1, 1979
6.422
-0.202
-3.05%
jan 1, 1980
10.371
+3.948
61.48%
jan 1, 1981
10.664
+0.293
2.83%
jan 1, 1982
8.484
-2.18
-20.44%
jan 1, 1983
7.57
-0.914
-10.78%
jan 1, 1984
6.017
-1.553
-20.51%
jan 1, 1985
5.742
-0.275
-4.57%
jan 1, 1986
5.338
-0.404
-7.04%
jan 1, 1987
2.469
-2.869
-53.74%
jan 1, 1988
3.315
+0.846
34.24%
jan 1, 1989
3.361
+0.047
1.4%
jan 1, 1990
4.004
+0.643
19.12%
jan 1, 1991
4.826
+0.822
20.53%
jan 1, 1992
3.327
-1.498
-31.05%
jan 1, 1993
3.007
-0.321
-9.63%
jan 1, 1994
2.801
-0.206
-6.86%
jan 1, 1995
2.35
-0.451
-16.1%
jan 1, 1996
2.402
+0.052
2.22%
jan 1, 1997
2.91
+0.508
21.15%
jan 1, 1998
2.591
-0.319
-10.96%
jan 1, 1999
1.702
-0.888
-34.28%
jan 1, 2000
2.317
+0.614
36.09%
jan 1, 2001
4.316
+1.999
86.27%
jan 1, 2002
3.785
-0.531
-12.3%
jan 1, 2003
3.683
-0.102
-2.69%
jan 1, 2004
4.555
+0.872
23.68%
jan 1, 2005
5.976
+1.421
31.2%
jan 1, 2006
7.305
+1.329
22.24%
jan 1, 2007
7.284
-0.021
-0.29%
jan 1, 2008
6.578
-0.706
-9.7%
jan 1, 2009
8.216
+1.638
24.9%
jan 1, 2010
4.372
-3.844
-46.79%
jan 1, 2011
4.908
+0.536
12.27%
jan 1, 2012
5.668
+0.76
15.49%
jan 1, 2013
4.761
-0.907
-16.0%
jan 1, 2014
4.089
-0.672
-14.11%
jan 1, 2015
2.966
-1.124
-27.48%
Ranking of countries by current statistics by years


Comments: