29
/
en
AIzaSyAYiBZKx7MnpbEhh9jyipgxe19OcubqV5w
April 1, 2024
77804
Bangladesh
BGD
true
2
1
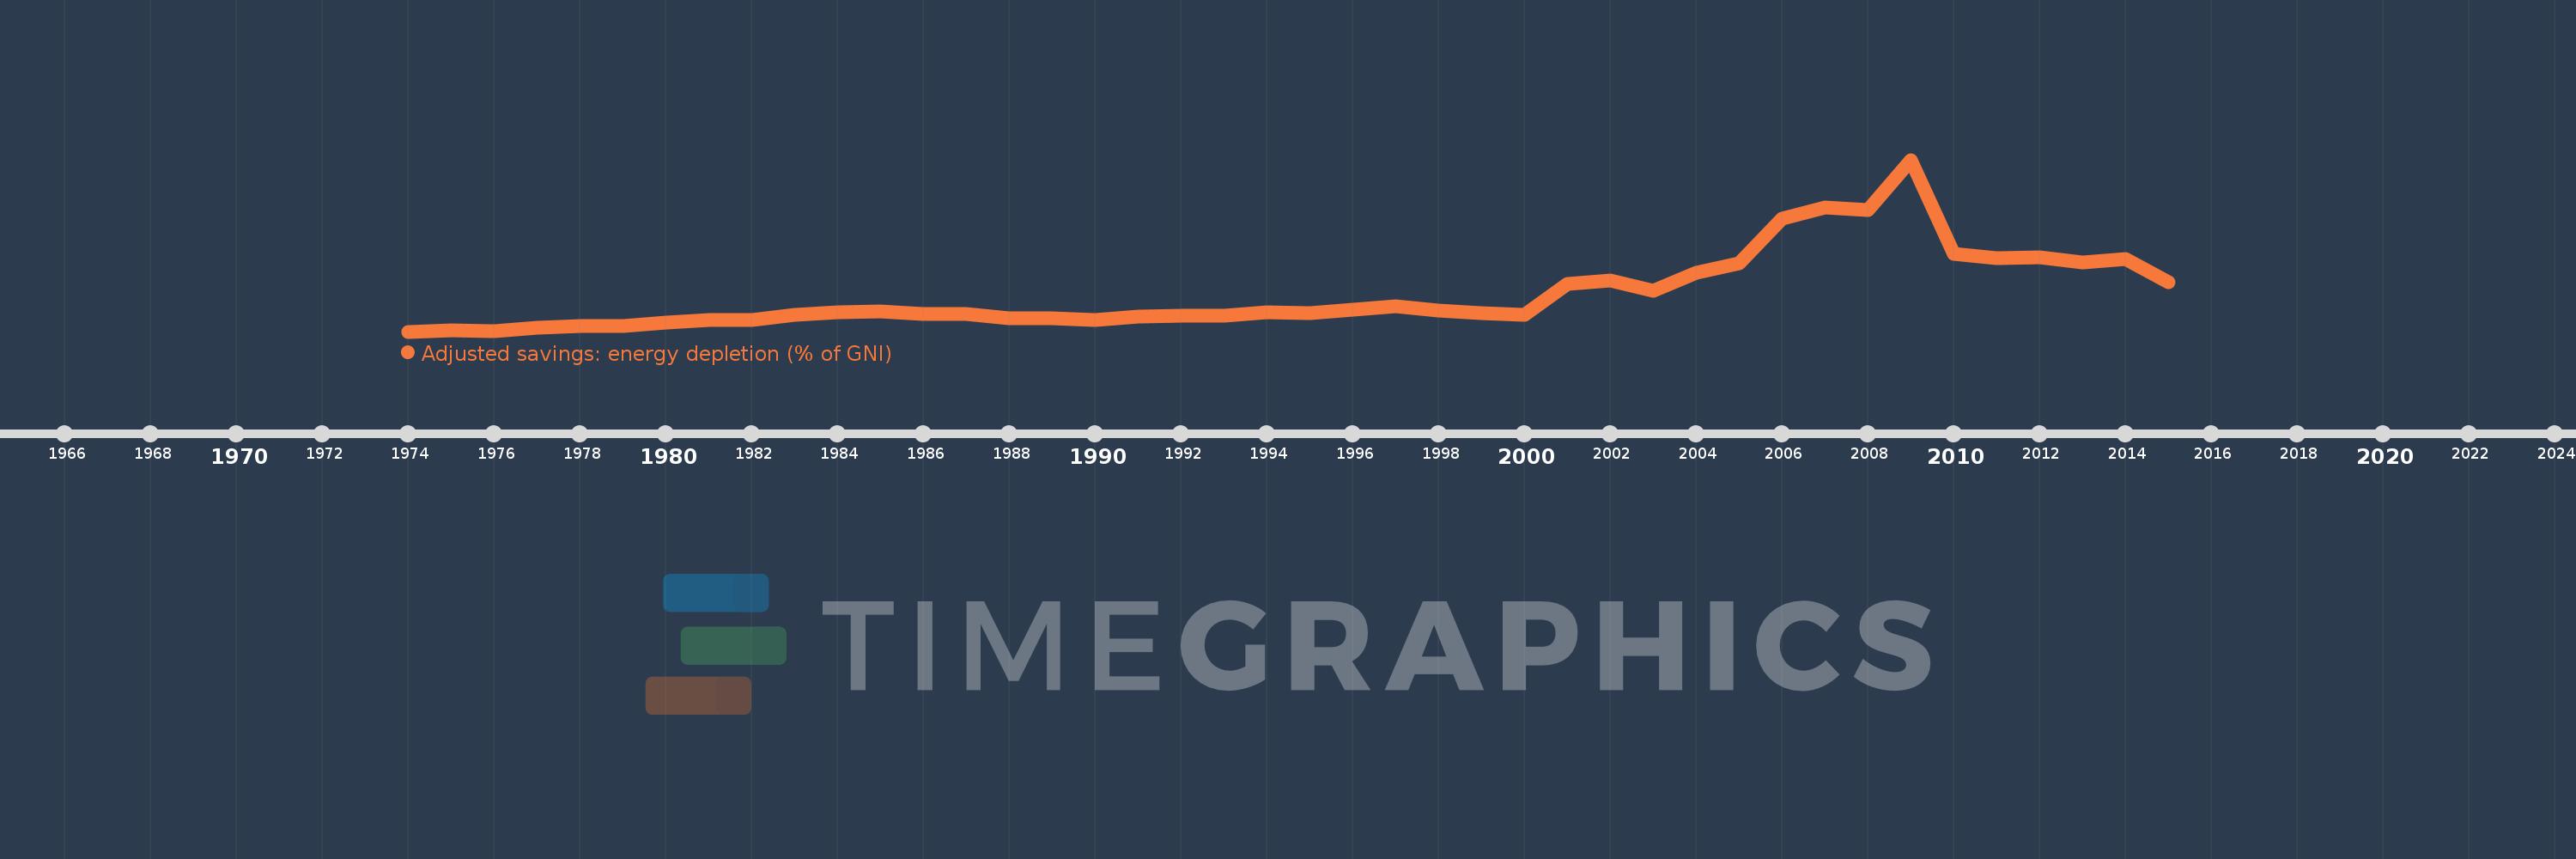
Adjusted savings: energy depletion (% of GNI)
2015,2014,2013,2012,2011,2010,2009,2008,2007,2006,2005,2004,2003,2002,2001,2000,1999,1998,1997,1996,1995,1994,1993,1992,1991,1990,1989,1988,1987,1986,1985,1984,1983,1982,1981,1980,1979,1978,1977,1976,1975,1974
This statistics in other country:
AfghanistanAlbaniaAlgeriaAmerican SamoaAndorraAngolaAntigua and BarbudaArab WorldArgentinaArmeniaAustraliaAustriaAzerbaijanBahamas, TheBahrainBangladeshBarbadosBelarusBelgiumBelizeBeninBermudaBhutanBoliviaBosnia and HerzegovinaBotswanaBrazilBrunei DarussalamBulgariaBurkina FasoBurundiCabo VerdeCambodiaCameroonCanadaCaribbean small statesCentral African RepublicCentral Europe and the BalticsChadChannel IslandsChileChinaColombiaComorosCongo, Dem. Rep.Congo, Rep.Costa RicaCote d'IvoireCroatiaCubaCyprusCzech RepublicDenmarkDjiboutiDominicaDominican RepublicEarly-demographic dividendEast Asia & PacificEast Asia & Pacific (excluding high income)East Asia & Pacific (IDA & IBRD countries)EcuadorEgypt, Arab Rep.El SalvadorEquatorial GuineaEritreaEstoniaEthiopiaEuro areaEurope & Central AsiaEurope & Central Asia (excluding high income)Europe & Central Asia (IDA & IBRD countries)European UnionFaroe IslandsFijiFinlandFragile and conflict affected situationsFranceFrench PolynesiaGabonGambia, TheGeorgiaGermanyGhanaGreeceGreenlandGrenadaGuatemalaGuineaGuinea-BissauGuyanaHaitiHeavily indebted poor countries (HIPC)High incomeHondurasHong Kong SAR, ChinaHungaryIBRD onlyIcelandIDA & IBRD totalIDA blendIDA onlyIDA totalIndiaIndonesiaIran, Islamic Rep.IraqIrelandIsle of ManIsraelItalyJamaicaJapanJordanKazakhstanKenyaKiribatiKorea, Rep.KosovoKuwaitKyrgyz RepublicLao PDRLate-demographic dividendLatin America & Caribbean Latin America & Caribbean (excluding high income)Latin America & the Caribbean (IDA & IBRD countries)LatviaLeast developed countries: UN classificationLebanonLesothoLiberiaLibyaLiechtensteinLithuaniaLow & middle incomeLow incomeLower middle incomeLuxembourgMacao SAR, ChinaMacedonia, FYRMadagascarMalawiMalaysiaMaldivesMaliMaltaMarshall IslandsMauritaniaMauritiusMexicoMicronesia, Fed. Sts.Middle East & North AfricaMiddle East & North Africa (excluding high income)Middle East & North Africa (IDA & IBRD countries)Middle incomeMoldovaMonacoMongoliaMontenegroMoroccoMozambiqueMyanmarNamibiaNepalNetherlandsNew CaledoniaNew ZealandNicaraguaNigerNigeriaNorth AmericaNorwayOECD membersOmanOther small statesPacific island small statesPakistanPalauPanamaPapua New GuineaParaguayPeruPhilippinesPolandPortugalPost-demographic dividendPre-demographic dividendPuerto RicoQatarRomaniaRussian FederationRwandaSamoaSan MarinoSao Tome and PrincipeSaudi ArabiaSenegalSerbiaSeychellesSierra LeoneSingaporeSlovak RepublicSloveniaSmall statesSolomon IslandsSomaliaSouth AfricaSouth AsiaSouth Asia (IDA & IBRD)South SudanSpainSri LankaSt. Kitts and NevisSt. LuciaSt. Vincent and the GrenadinesSub-Saharan Africa Sub-Saharan Africa (excluding high income)Sub-Saharan Africa (IDA & IBRD countries)SudanSurinameSwazilandSwedenSwitzerlandSyrian Arab RepublicTajikistanTanzaniaThailandTimor-LesteTogoTongaTrinidad and TobagoTunisiaTurkeyTurkmenistanTuvaluUgandaUkraineUnited Arab EmiratesUnited KingdomUnited StatesUpper middle incomeUruguayUzbekistanVanuatuVenezuela, RBVietnamVirgin Islands (U.S.)West Bank and GazaWorldYemen, Rep.ZambiaZimbabwe Timeline:
This timeline shows a graph from 1974 to 2015 of Bangladesh. No data until 1973. Number of actual observations by date: 42.
Source name:
World Development Indicators
Source organization:
World Bank staff estimates based on sources and methods in World Bank's "The Changing Wealth of Nations: Measuring Sustainable Development in the New Millennium" (2011).
Categories, topics:
Economy & Growth, Energy & Mining, Environment
Last updated:
apr 23, 2017
Indicators value changes by year
At the date of observation
Value
Absolute change
Change from previous value
jan 1, 1974
0.047
+0.047
0.0%
jan 1, 1975
0.077
+0.03
62.77%
jan 1, 1976
0.052
-0.025
-33.11%
jan 1, 1977
0.144
+0.092
179.56%
jan 1, 1978
0.188
+0.044
30.77%
jan 1, 1979
0.189
+0.001
0.35%
jan 1, 1980
0.258
+0.069
36.61%
jan 1, 1981
0.317
+0.059
22.95%
jan 1, 1982
0.315
-0.002
-0.78%
jan 1, 1983
0.453
+0.139
44.01%
jan 1, 1984
0.502
+0.049
10.78%
jan 1, 1985
0.527
+0.025
4.88%
jan 1, 1986
0.472
-0.055
-10.48%
jan 1, 1987
0.479
+0.007
1.48%
jan 1, 1988
0.364
-0.115
-24.05%
jan 1, 1989
0.358
-0.005
-1.42%
jan 1, 1990
0.319
-0.039
-10.87%
jan 1, 1991
0.414
+0.095
29.59%
jan 1, 1992
0.436
+0.022
5.42%
jan 1, 1993
0.42
-0.016
-3.64%
jan 1, 1994
0.52
+0.1
23.79%
jan 1, 1995
0.498
-0.023
-4.33%
jan 1, 1996
0.563
+0.065
13.11%
jan 1, 1997
0.653
+0.09
15.94%
jan 1, 1998
0.562
-0.091
-13.88%
jan 1, 1999
0.483
-0.079
-14.12%
jan 1, 2000
0.452
-0.031
-6.41%
jan 1, 2001
1.187
+0.734
162.46%
jan 1, 2002
1.265
+0.078
6.61%
jan 1, 2003
1.028
-0.237
-18.72%
jan 1, 2004
1.464
+0.436
42.42%
jan 1, 2005
1.679
+0.215
14.69%
jan 1, 2006
2.768
+1.089
64.83%
jan 1, 2007
3.034
+0.266
9.61%
jan 1, 2008
2.968
-0.066
-2.19%
jan 1, 2009
4.17
+1.202
40.51%
jan 1, 2010
1.917
-2.253
-54.03%
jan 1, 2011
1.807
-0.11
-5.72%
jan 1, 2012
1.832
+0.025
1.37%
jan 1, 2013
1.712
-0.12
-6.52%
jan 1, 2014
1.786
+0.074
4.32%
jan 1, 2015
1.237
-0.549
-30.75%
Ranking of countries by current statistics by years


Comments: