29
/
en
AIzaSyAYiBZKx7MnpbEhh9jyipgxe19OcubqV5w
April 1, 2024
280564
Venezuela, RB
VEN
true
2
1
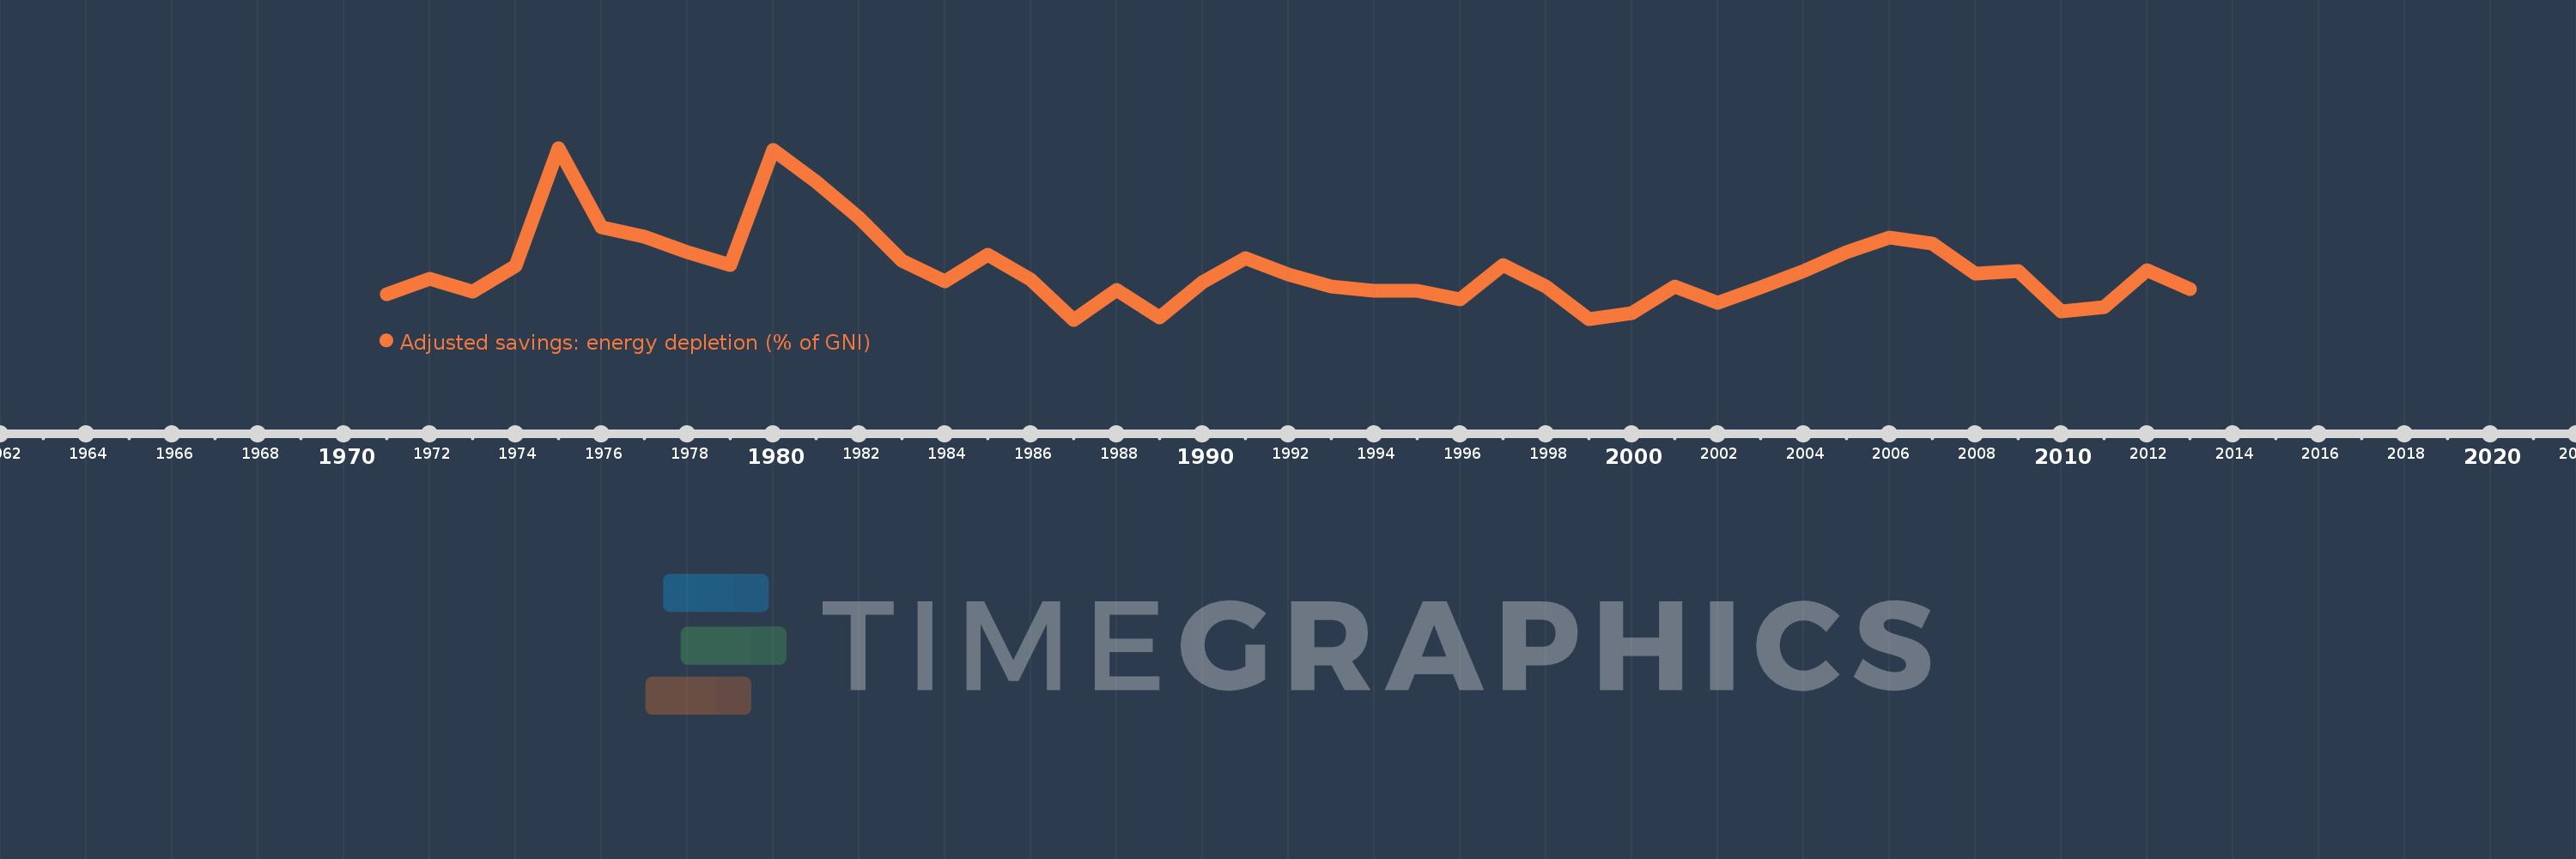
Adjusted savings: energy depletion (% of GNI)
2013,2012,2011,2010,2009,2008,2007,2006,2005,2004,2003,2002,2001,2000,1999,1998,1997,1996,1995,1994,1993,1992,1991,1990,1989,1988,1987,1986,1985,1984,1983,1982,1981,1980,1979,1978,1977,1976,1975,1974,1973,1972,1971
This statistics in other country:
AfghanistanAlbaniaAlgeriaAmerican SamoaAndorraAngolaAntigua and BarbudaArab WorldArgentinaArmeniaAustraliaAustriaAzerbaijanBahamas, TheBahrainBangladeshBarbadosBelarusBelgiumBelizeBeninBermudaBhutanBoliviaBosnia and HerzegovinaBotswanaBrazilBrunei DarussalamBulgariaBurkina FasoBurundiCabo VerdeCambodiaCameroonCanadaCaribbean small statesCentral African RepublicCentral Europe and the BalticsChadChannel IslandsChileChinaColombiaComorosCongo, Dem. Rep.Congo, Rep.Costa RicaCote d'IvoireCroatiaCubaCyprusCzech RepublicDenmarkDjiboutiDominicaDominican RepublicEarly-demographic dividendEast Asia & PacificEast Asia & Pacific (excluding high income)East Asia & Pacific (IDA & IBRD countries)EcuadorEgypt, Arab Rep.El SalvadorEquatorial GuineaEritreaEstoniaEthiopiaEuro areaEurope & Central AsiaEurope & Central Asia (excluding high income)Europe & Central Asia (IDA & IBRD countries)European UnionFaroe IslandsFijiFinlandFragile and conflict affected situationsFranceFrench PolynesiaGabonGambia, TheGeorgiaGermanyGhanaGreeceGreenlandGrenadaGuatemalaGuineaGuinea-BissauGuyanaHaitiHeavily indebted poor countries (HIPC)High incomeHondurasHong Kong SAR, ChinaHungaryIBRD onlyIcelandIDA & IBRD totalIDA blendIDA onlyIDA totalIndiaIndonesiaIran, Islamic Rep.IraqIrelandIsle of ManIsraelItalyJamaicaJapanJordanKazakhstanKenyaKiribatiKorea, Rep.KosovoKuwaitKyrgyz RepublicLao PDRLate-demographic dividendLatin America & Caribbean Latin America & Caribbean (excluding high income)Latin America & the Caribbean (IDA & IBRD countries)LatviaLeast developed countries: UN classificationLebanonLesothoLiberiaLibyaLiechtensteinLithuaniaLow & middle incomeLow incomeLower middle incomeLuxembourgMacao SAR, ChinaMacedonia, FYRMadagascarMalawiMalaysiaMaldivesMaliMaltaMarshall IslandsMauritaniaMauritiusMexicoMicronesia, Fed. Sts.Middle East & North AfricaMiddle East & North Africa (excluding high income)Middle East & North Africa (IDA & IBRD countries)Middle incomeMoldovaMonacoMongoliaMontenegroMoroccoMozambiqueMyanmarNamibiaNepalNetherlandsNew CaledoniaNew ZealandNicaraguaNigerNigeriaNorth AmericaNorwayOECD membersOmanOther small statesPacific island small statesPakistanPalauPanamaPapua New GuineaParaguayPeruPhilippinesPolandPortugalPost-demographic dividendPre-demographic dividendPuerto RicoQatarRomaniaRussian FederationRwandaSamoaSan MarinoSao Tome and PrincipeSaudi ArabiaSenegalSerbiaSeychellesSierra LeoneSingaporeSlovak RepublicSloveniaSmall statesSolomon IslandsSomaliaSouth AfricaSouth AsiaSouth Asia (IDA & IBRD)South SudanSpainSri LankaSt. Kitts and NevisSt. LuciaSt. Vincent and the GrenadinesSub-Saharan Africa Sub-Saharan Africa (excluding high income)Sub-Saharan Africa (IDA & IBRD countries)SudanSurinameSwazilandSwedenSwitzerlandSyrian Arab RepublicTajikistanTanzaniaThailandTimor-LesteTogoTongaTrinidad and TobagoTunisiaTurkeyTurkmenistanTuvaluUgandaUkraineUnited Arab EmiratesUnited KingdomUnited StatesUpper middle incomeUruguayUzbekistanVanuatuVenezuela, RBVietnamVirgin Islands (U.S.)West Bank and GazaWorldYemen, Rep.ZambiaZimbabwe Timeline:
This timeline shows a graph from 1971 to 2013 of Venezuela, RB. No data until 1970. Number of actual observations by date: 43.
Source name:
World Development Indicators
Source organization:
World Bank staff estimates based on sources and methods in World Bank's "The Changing Wealth of Nations: Measuring Sustainable Development in the New Millennium" (2011).
Categories, topics:
Economy & Growth, Energy & Mining, Environment
Last updated:
apr 23, 2017
Indicators value changes by year
Maximum:
33.008
jan 1, 1975
At the date of observation
Value
Absolute change
Change from previous value
jan 1, 1971
10.548
+10.548
0.0%
jan 1, 1972
12.906
+2.359
22.36%
jan 1, 1973
10.957
-1.949
-15.1%
jan 1, 1974
14.839
+3.882
35.43%
jan 1, 1975
33.008
+18.169
122.44%
jan 1, 1976
20.772
-12.235
-37.07%
jan 1, 1977
19.368
-1.404
-6.76%
jan 1, 1978
17.007
-2.361
-12.19%
jan 1, 1979
14.989
-2.018
-11.87%
jan 1, 1980
32.761
+17.772
118.57%
jan 1, 1981
27.802
-4.959
-15.14%
jan 1, 1982
22.347
-5.455
-19.62%
jan 1, 1983
15.656
-6.691
-29.94%
jan 1, 1984
12.573
-3.082
-19.69%
jan 1, 1985
16.656
+4.083
32.47%
jan 1, 1986
12.733
-3.923
-23.55%
jan 1, 1987
6.633
-6.099
-47.9%
jan 1, 1988
11.21
+4.577
69.0%
jan 1, 1989
7.034
-4.176
-37.25%
jan 1, 1990
12.454
+5.42
77.05%
jan 1, 1991
16.154
+3.7
29.71%
jan 1, 1992
13.545
-2.609
-16.15%
jan 1, 1993
11.783
-1.762
-13.01%
jan 1, 1994
11.099
-0.684
-5.8%
jan 1, 1995
11.019
-0.08
-0.72%
jan 1, 1996
9.77
-1.249
-11.33%
jan 1, 1997
15.036
+5.266
53.9%
jan 1, 1998
11.717
-3.319
-22.07%
jan 1, 1999
6.689
-5.028
-42.91%
jan 1, 2000
7.6
+0.911
13.62%
jan 1, 2001
11.687
+4.087
53.77%
jan 1, 2002
9.274
-2.413
-20.65%
jan 1, 2003
11.61
+2.336
25.19%
jan 1, 2004
14.118
+2.508
21.6%
jan 1, 2005
17.073
+2.955
20.93%
jan 1, 2006
19.294
+2.221
13.01%
jan 1, 2007
18.33
-0.964
-5.0%
jan 1, 2008
13.672
-4.658
-25.41%
jan 1, 2009
14.146
+0.474
3.47%
jan 1, 2010
7.964
-6.182
-43.7%
jan 1, 2011
8.582
+0.619
7.77%
jan 1, 2012
14.268
+5.686
66.25%
jan 1, 2013
11.371
-2.897
-20.31%
Ranking of countries by current statistics by years


Comments: