29
/
en
AIzaSyAYiBZKx7MnpbEhh9jyipgxe19OcubqV5w
April 1, 2024
138967
Germany
DEU
true
2
1
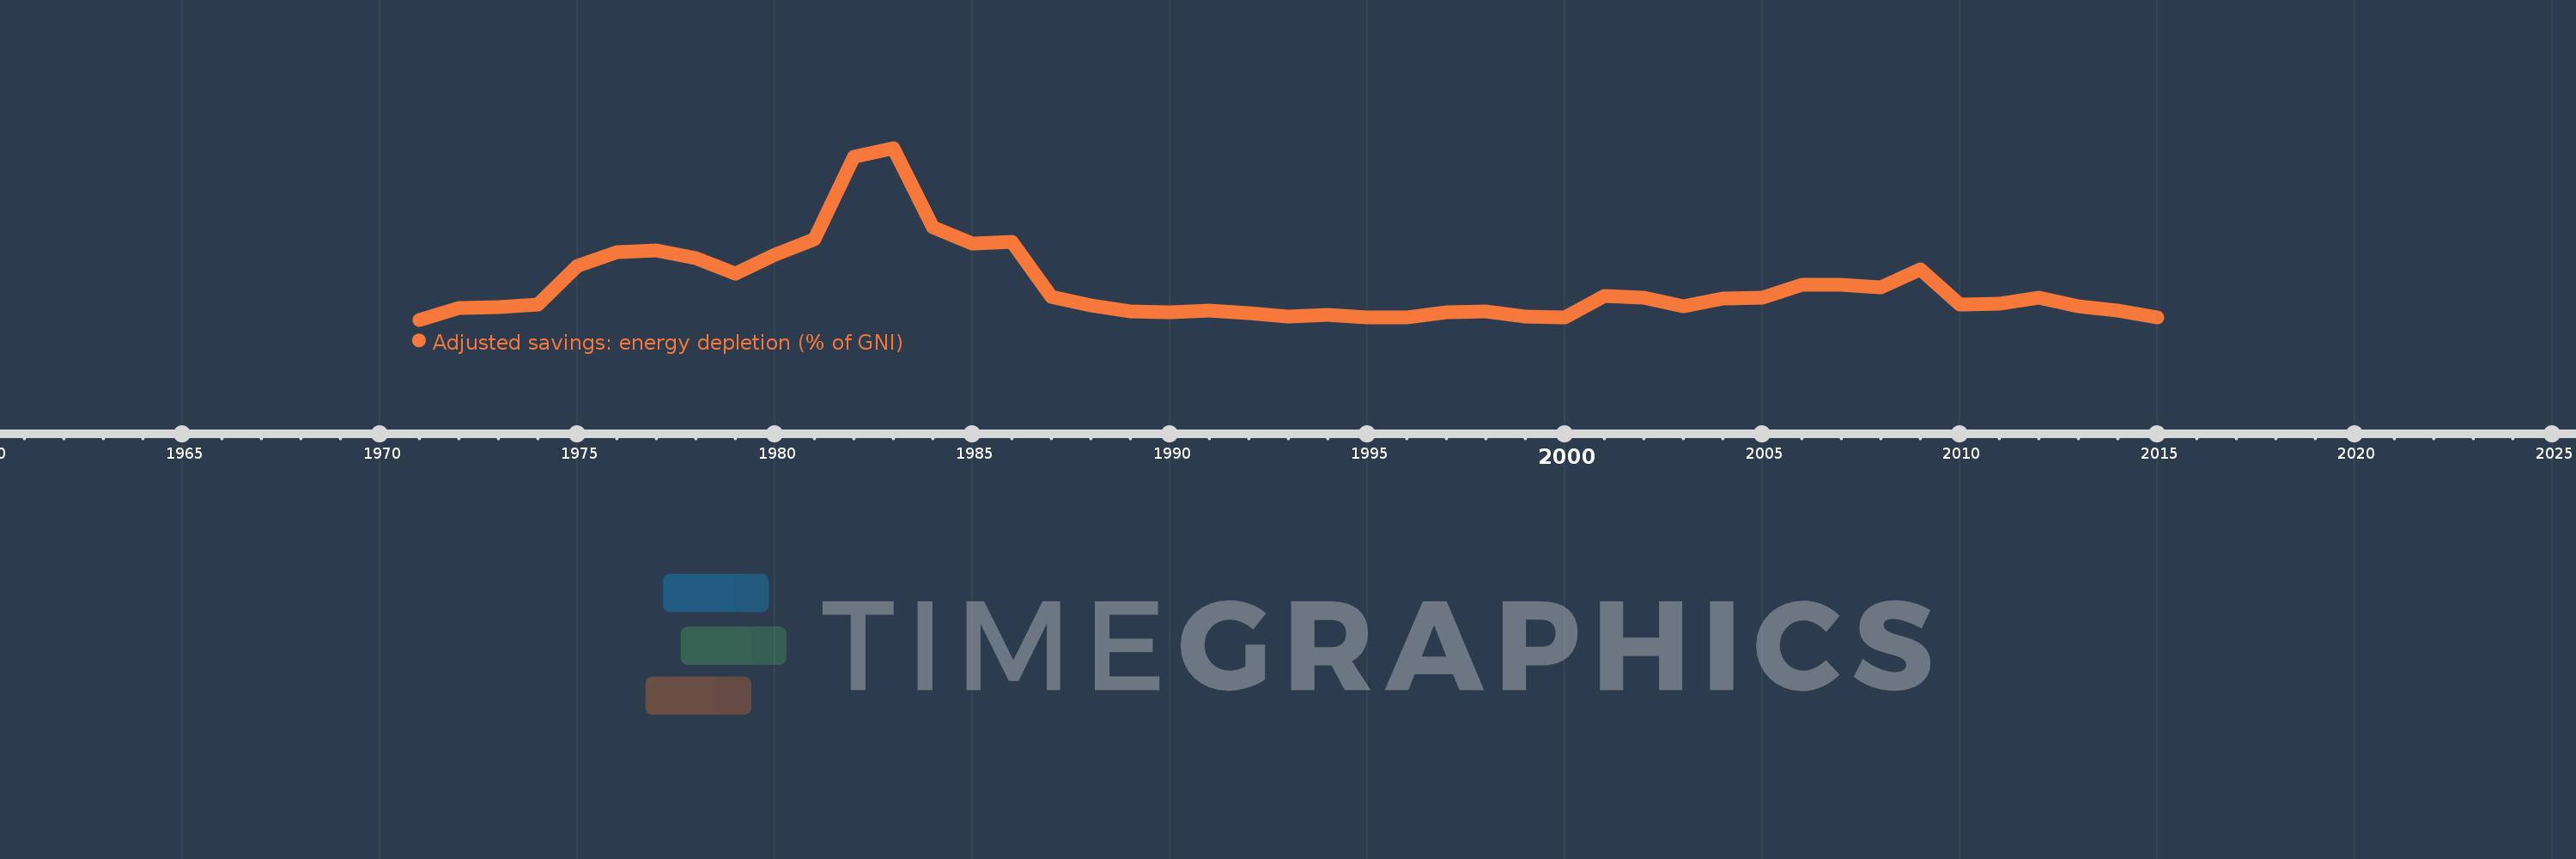
Adjusted savings: energy depletion (% of GNI)
2015,2014,2013,2012,2011,2010,2009,2008,2007,2006,2005,2004,2003,2002,2001,2000,1999,1998,1997,1996,1995,1994,1993,1992,1991,1990,1989,1988,1987,1986,1985,1984,1983,1982,1981,1980,1979,1978,1977,1976,1975,1974,1973,1972,1971
This statistics in other country:
AfghanistanAlbaniaAlgeriaAmerican SamoaAndorraAngolaAntigua and BarbudaArab WorldArgentinaArmeniaAustraliaAustriaAzerbaijanBahamas, TheBahrainBangladeshBarbadosBelarusBelgiumBelizeBeninBermudaBhutanBoliviaBosnia and HerzegovinaBotswanaBrazilBrunei DarussalamBulgariaBurkina FasoBurundiCabo VerdeCambodiaCameroonCanadaCaribbean small statesCentral African RepublicCentral Europe and the BalticsChadChannel IslandsChileChinaColombiaComorosCongo, Dem. Rep.Congo, Rep.Costa RicaCote d'IvoireCroatiaCubaCyprusCzech RepublicDenmarkDjiboutiDominicaDominican RepublicEarly-demographic dividendEast Asia & PacificEast Asia & Pacific (excluding high income)East Asia & Pacific (IDA & IBRD countries)EcuadorEgypt, Arab Rep.El SalvadorEquatorial GuineaEritreaEstoniaEthiopiaEuro areaEurope & Central AsiaEurope & Central Asia (excluding high income)Europe & Central Asia (IDA & IBRD countries)European UnionFaroe IslandsFijiFinlandFragile and conflict affected situationsFranceFrench PolynesiaGabonGambia, TheGeorgiaGermanyGhanaGreeceGreenlandGrenadaGuatemalaGuineaGuinea-BissauGuyanaHaitiHeavily indebted poor countries (HIPC)High incomeHondurasHong Kong SAR, ChinaHungaryIBRD onlyIcelandIDA & IBRD totalIDA blendIDA onlyIDA totalIndiaIndonesiaIran, Islamic Rep.IraqIrelandIsle of ManIsraelItalyJamaicaJapanJordanKazakhstanKenyaKiribatiKorea, Rep.KosovoKuwaitKyrgyz RepublicLao PDRLate-demographic dividendLatin America & Caribbean Latin America & Caribbean (excluding high income)Latin America & the Caribbean (IDA & IBRD countries)LatviaLeast developed countries: UN classificationLebanonLesothoLiberiaLibyaLiechtensteinLithuaniaLow & middle incomeLow incomeLower middle incomeLuxembourgMacao SAR, ChinaMacedonia, FYRMadagascarMalawiMalaysiaMaldivesMaliMaltaMarshall IslandsMauritaniaMauritiusMexicoMicronesia, Fed. Sts.Middle East & North AfricaMiddle East & North Africa (excluding high income)Middle East & North Africa (IDA & IBRD countries)Middle incomeMoldovaMonacoMongoliaMontenegroMoroccoMozambiqueMyanmarNamibiaNepalNetherlandsNew CaledoniaNew ZealandNicaraguaNigerNigeriaNorth AmericaNorwayOECD membersOmanOther small statesPacific island small statesPakistanPalauPanamaPapua New GuineaParaguayPeruPhilippinesPolandPortugalPost-demographic dividendPre-demographic dividendPuerto RicoQatarRomaniaRussian FederationRwandaSamoaSan MarinoSao Tome and PrincipeSaudi ArabiaSenegalSerbiaSeychellesSierra LeoneSingaporeSlovak RepublicSloveniaSmall statesSolomon IslandsSomaliaSouth AfricaSouth AsiaSouth Asia (IDA & IBRD)South SudanSpainSri LankaSt. Kitts and NevisSt. LuciaSt. Vincent and the GrenadinesSub-Saharan Africa Sub-Saharan Africa (excluding high income)Sub-Saharan Africa (IDA & IBRD countries)SudanSurinameSwazilandSwedenSwitzerlandSyrian Arab RepublicTajikistanTanzaniaThailandTimor-LesteTogoTongaTrinidad and TobagoTunisiaTurkeyTurkmenistanTuvaluUgandaUkraineUnited Arab EmiratesUnited KingdomUnited StatesUpper middle incomeUruguayUzbekistanVanuatuVenezuela, RBVietnamVirgin Islands (U.S.)West Bank and GazaWorldYemen, Rep.ZambiaZimbabwe Timeline:
This timeline shows a graph from 1971 to 2015 of Germany. No data until 1970. Number of actual observations by date: 45.
Source name:
World Development Indicators
Source organization:
World Bank staff estimates based on sources and methods in World Bank's "The Changing Wealth of Nations: Measuring Sustainable Development in the New Millennium" (2011).
Categories, topics:
Economy & Growth, Energy & Mining, Environment
Last updated:
apr 23, 2017
Indicators value changes by year
At the date of observation
Value
Absolute change
Change from previous value
jan 1, 1971
0.032
+0.032
0.0%
jan 1, 1972
0.072
+0.04
124.82%
jan 1, 1973
0.074
+0.002
2.34%
jan 1, 1974
0.082
+0.008
10.8%
jan 1, 1975
0.213
+0.131
160.43%
jan 1, 1976
0.259
+0.046
21.35%
jan 1, 1977
0.264
+0.005
1.86%
jan 1, 1978
0.238
-0.026
-9.81%
jan 1, 1979
0.186
-0.052
-21.78%
jan 1, 1980
0.25
+0.064
34.29%
jan 1, 1981
0.303
+0.053
21.19%
jan 1, 1982
0.581
+0.278
91.92%
jan 1, 1983
0.61
+0.029
4.96%
jan 1, 1984
0.344
-0.266
-43.55%
jan 1, 1985
0.288
-0.056
-16.35%
jan 1, 1986
0.293
+0.005
1.71%
jan 1, 1987
0.11
-0.183
-62.45%
jan 1, 1988
0.08
-0.03
-27.46%
jan 1, 1989
0.06
-0.02
-24.69%
jan 1, 1990
0.057
-0.003
-5.65%
jan 1, 1991
0.062
+0.005
9.6%
jan 1, 1992
0.055
-0.007
-11.48%
jan 1, 1993
0.043
-0.012
-21.73%
jan 1, 1994
0.049
+0.006
13.61%
jan 1, 1995
0.041
-0.008
-15.93%
jan 1, 1996
0.039
-0.003
-6.34%
jan 1, 1997
0.058
+0.019
49.5%
jan 1, 1998
0.059
+0.001
2.34%
jan 1, 1999
0.042
-0.017
-29.01%
jan 1, 2000
0.04
-0.002
-3.91%
jan 1, 2001
0.111
+0.071
175.82%
jan 1, 2002
0.105
-0.005
-4.92%
jan 1, 2003
0.077
-0.028
-26.61%
jan 1, 2004
0.104
+0.027
34.64%
jan 1, 2005
0.106
+0.002
1.53%
jan 1, 2006
0.15
+0.044
41.63%
jan 1, 2007
0.15
+0.0
0.31%
jan 1, 2008
0.142
-0.009
-5.67%
jan 1, 2009
0.202
+0.061
42.79%
jan 1, 2010
0.083
-0.12
-59.05%
jan 1, 2011
0.086
+0.003
3.43%
jan 1, 2012
0.107
+0.021
24.66%
jan 1, 2013
0.076
-0.031
-28.68%
jan 1, 2014
0.064
-0.012
-15.56%
jan 1, 2015
0.04
-0.024
-37.6%
Ranking of countries by current statistics by years


Comments: