29
/
en
AIzaSyAYiBZKx7MnpbEhh9jyipgxe19OcubqV5w
April 1, 2024
31277
Europe & Central Asia (excluding high income)
ECA
false
2
1
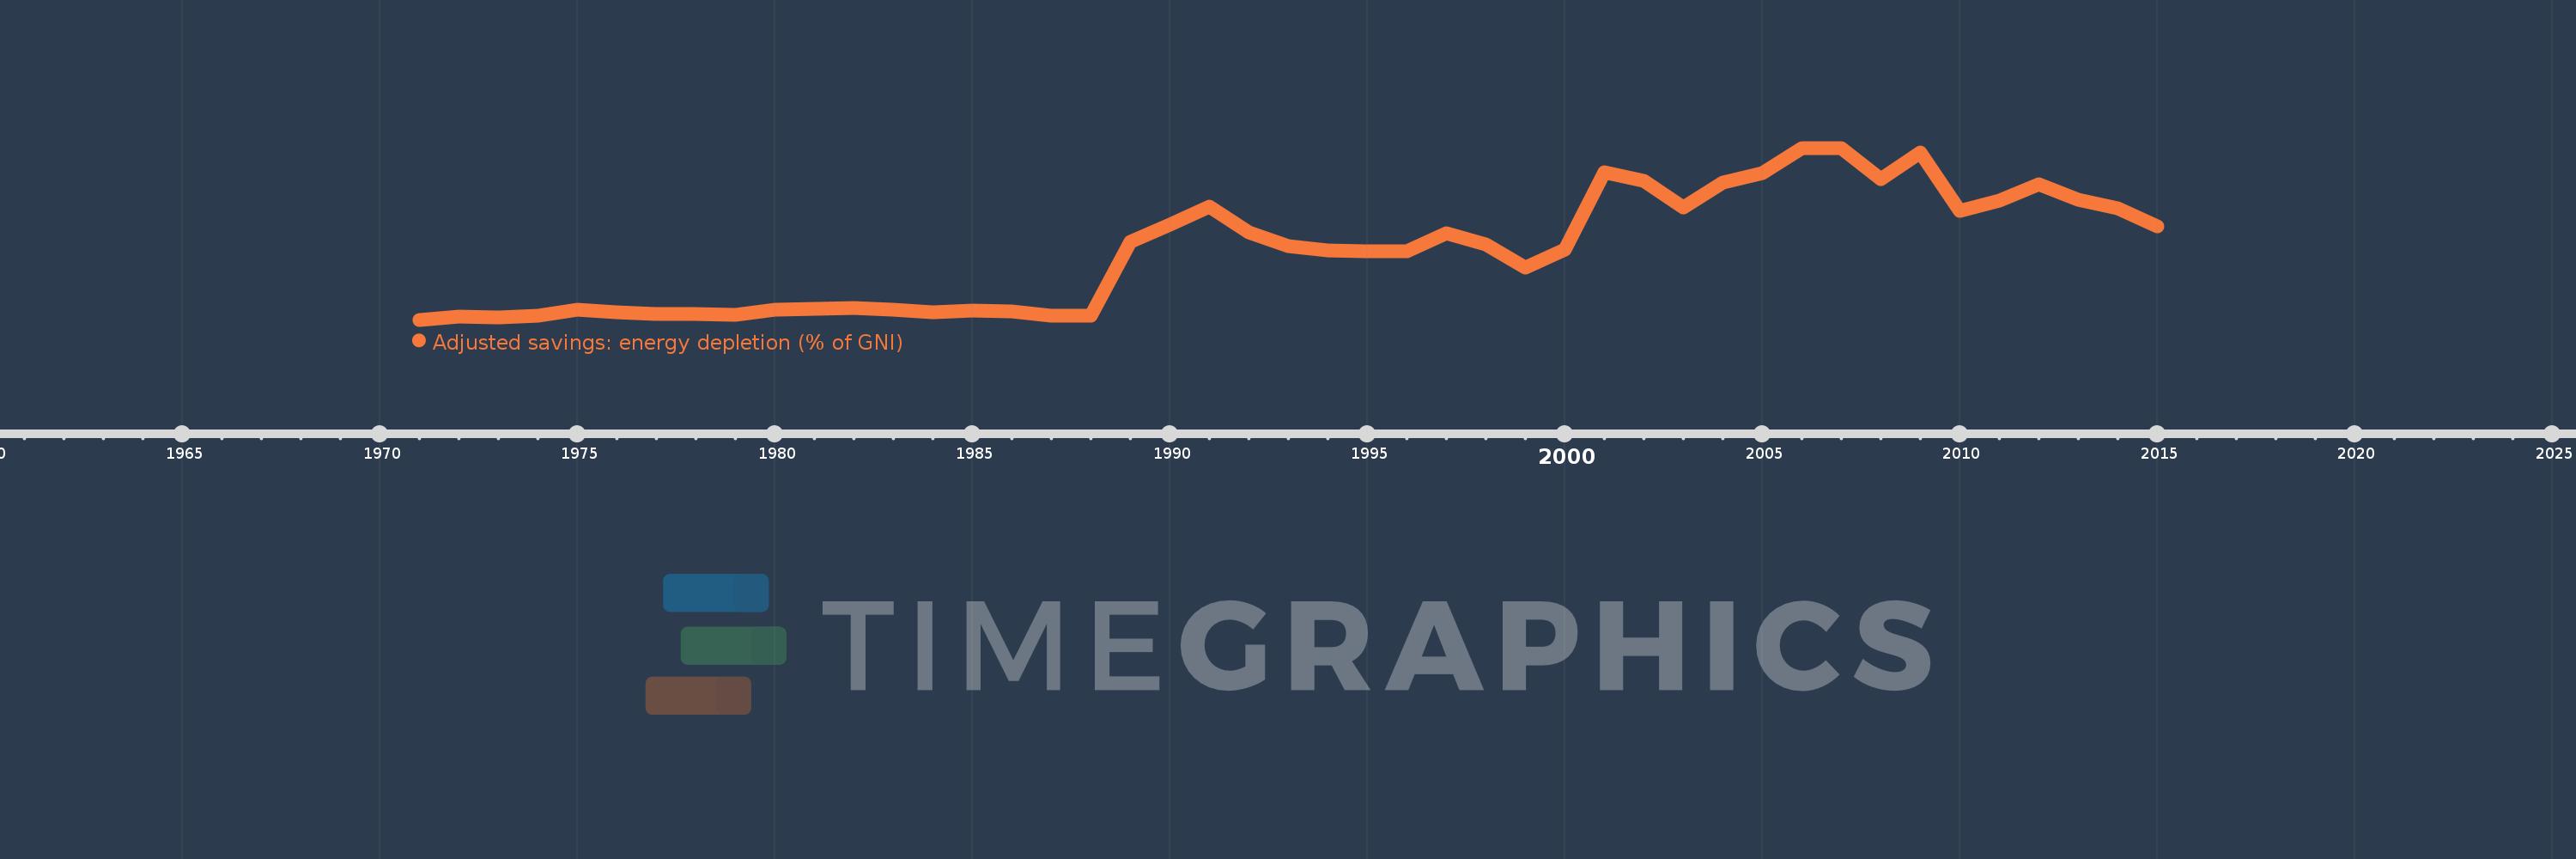
Adjusted savings: energy depletion (% of GNI)
2015,2014,2013,2012,2011,2010,2009,2008,2007,2006,2005,2004,2003,2002,2001,2000,1999,1998,1997,1996,1995,1994,1993,1992,1991,1990,1989,1988,1987,1986,1985,1984,1983,1982,1981,1980,1979,1978,1977,1976,1975,1974,1973,1972,1971
This statistics in other country:
AfghanistanAlbaniaAlgeriaAmerican SamoaAndorraAngolaAntigua and BarbudaArab WorldArgentinaArmeniaAustraliaAustriaAzerbaijanBahamas, TheBahrainBangladeshBarbadosBelarusBelgiumBelizeBeninBermudaBhutanBoliviaBosnia and HerzegovinaBotswanaBrazilBrunei DarussalamBulgariaBurkina FasoBurundiCabo VerdeCambodiaCameroonCanadaCaribbean small statesCentral African RepublicCentral Europe and the BalticsChadChannel IslandsChileChinaColombiaComorosCongo, Dem. Rep.Congo, Rep.Costa RicaCote d'IvoireCroatiaCubaCyprusCzech RepublicDenmarkDjiboutiDominicaDominican RepublicEarly-demographic dividendEast Asia & PacificEast Asia & Pacific (excluding high income)East Asia & Pacific (IDA & IBRD countries)EcuadorEgypt, Arab Rep.El SalvadorEquatorial GuineaEritreaEstoniaEthiopiaEuro areaEurope & Central AsiaEurope & Central Asia (excluding high income)Europe & Central Asia (IDA & IBRD countries)European UnionFaroe IslandsFijiFinlandFragile and conflict affected situationsFranceFrench PolynesiaGabonGambia, TheGeorgiaGermanyGhanaGreeceGreenlandGrenadaGuatemalaGuineaGuinea-BissauGuyanaHaitiHeavily indebted poor countries (HIPC)High incomeHondurasHong Kong SAR, ChinaHungaryIBRD onlyIcelandIDA & IBRD totalIDA blendIDA onlyIDA totalIndiaIndonesiaIran, Islamic Rep.IraqIrelandIsle of ManIsraelItalyJamaicaJapanJordanKazakhstanKenyaKiribatiKorea, Rep.KosovoKuwaitKyrgyz RepublicLao PDRLate-demographic dividendLatin America & Caribbean Latin America & Caribbean (excluding high income)Latin America & the Caribbean (IDA & IBRD countries)LatviaLeast developed countries: UN classificationLebanonLesothoLiberiaLibyaLiechtensteinLithuaniaLow & middle incomeLow incomeLower middle incomeLuxembourgMacao SAR, ChinaMacedonia, FYRMadagascarMalawiMalaysiaMaldivesMaliMaltaMarshall IslandsMauritaniaMauritiusMexicoMicronesia, Fed. Sts.Middle East & North AfricaMiddle East & North Africa (excluding high income)Middle East & North Africa (IDA & IBRD countries)Middle incomeMoldovaMonacoMongoliaMontenegroMoroccoMozambiqueMyanmarNamibiaNepalNetherlandsNew CaledoniaNew ZealandNicaraguaNigerNigeriaNorth AmericaNorwayOECD membersOmanOther small statesPacific island small statesPakistanPalauPanamaPapua New GuineaParaguayPeruPhilippinesPolandPortugalPost-demographic dividendPre-demographic dividendPuerto RicoQatarRomaniaRussian FederationRwandaSamoaSan MarinoSao Tome and PrincipeSaudi ArabiaSenegalSerbiaSeychellesSierra LeoneSingaporeSlovak RepublicSloveniaSmall statesSolomon IslandsSomaliaSouth AfricaSouth AsiaSouth Asia (IDA & IBRD)South SudanSpainSri LankaSt. Kitts and NevisSt. LuciaSt. Vincent and the GrenadinesSub-Saharan Africa Sub-Saharan Africa (excluding high income)Sub-Saharan Africa (IDA & IBRD countries)SudanSurinameSwazilandSwedenSwitzerlandSyrian Arab RepublicTajikistanTanzaniaThailandTimor-LesteTogoTongaTrinidad and TobagoTunisiaTurkeyTurkmenistanTuvaluUgandaUkraineUnited Arab EmiratesUnited KingdomUnited StatesUpper middle incomeUruguayUzbekistanVanuatuVenezuela, RBVietnamVirgin Islands (U.S.)West Bank and GazaWorldYemen, Rep.ZambiaZimbabwe Timeline:
This timeline shows a graph from 1971 to 2015 of Europe & Central Asia (excluding high income). No data until 1970. Number of actual observations by date: 45.
Source name:
World Development Indicators
Source organization:
World Bank staff estimates based on sources and methods in World Bank's "The Changing Wealth of Nations: Measuring Sustainable Development in the New Millennium" (2011).
Categories, topics:
Economy & Growth, Energy & Mining, Environment
Last updated:
apr 23, 2017
Indicators value changes by year
Maximum:
11.167
jan 1, 2006
At the date of observation
Value
Absolute change
Change from previous value
jan 1, 1972
0.218
+0.218
%
jan 1, 1973
0.177
-0.041
-18.74%
jan 1, 1974
0.238
+0.061
34.18%
jan 1, 1975
0.656
+0.419
176.0%
jan 1, 1976
0.48
-0.177
-26.92%
jan 1, 1977
0.386
-0.094
-19.57%
jan 1, 1978
0.363
-0.023
-5.89%
jan 1, 1979
0.34
-0.023
-6.31%
jan 1, 1980
0.631
+0.291
85.45%
jan 1, 1981
0.693
+0.062
9.8%
jan 1, 1982
0.738
+0.046
6.59%
jan 1, 1983
0.661
-0.077
-10.44%
jan 1, 1984
0.47
-0.191
-28.86%
jan 1, 1985
0.595
+0.124
26.37%
jan 1, 1986
0.535
-0.06
-10.1%
jan 1, 1987
0.236
-0.299
-55.92%
jan 1, 1988
0.253
+0.017
7.21%
jan 1, 1989
5.082
+4.83
1.91K%
jan 1, 1990
6.155
+1.073
21.11%
jan 1, 1991
7.343
+1.188
19.31%
jan 1, 1992
5.702
-1.641
-22.35%
jan 1, 1993
4.774
-0.928
-16.27%
jan 1, 1994
4.497
-0.277
-5.8%
jan 1, 1995
4.425
-0.072
-1.6%
jan 1, 1996
4.436
+0.011
0.26%
jan 1, 1997
5.602
+1.166
26.27%
jan 1, 1998
4.879
-0.723
-12.91%
jan 1, 1999
3.364
-1.515
-31.05%
jan 1, 2000
4.549
+1.185
35.24%
jan 1, 2001
9.607
+5.058
111.19%
jan 1, 2002
9.048
-0.559
-5.82%
jan 1, 2003
7.286
-1.761
-19.47%
jan 1, 2004
8.91
+1.624
22.28%
jan 1, 2005
9.537
+0.628
7.04%
jan 1, 2006
11.167
+1.63
17.09%
jan 1, 2007
11.128
-0.039
-0.35%
jan 1, 2008
9.152
-1.977
-17.76%
jan 1, 2009
10.867
+1.715
18.74%
jan 1, 2010
7.085
-3.782
-34.8%
jan 1, 2011
7.728
+0.643
9.07%
jan 1, 2012
8.8
+1.073
13.88%
jan 1, 2013
7.81
-0.99
-11.25%
jan 1, 2014
7.23
-0.579
-7.42%
jan 1, 2015
6.08
-1.151
-15.91%
Ranking of countries by current statistics by years


Comments: