29
/
en
AIzaSyAYiBZKx7MnpbEhh9jyipgxe19OcubqV5w
April 1, 2024
44789
Low & middle income
LMY
false
2
1
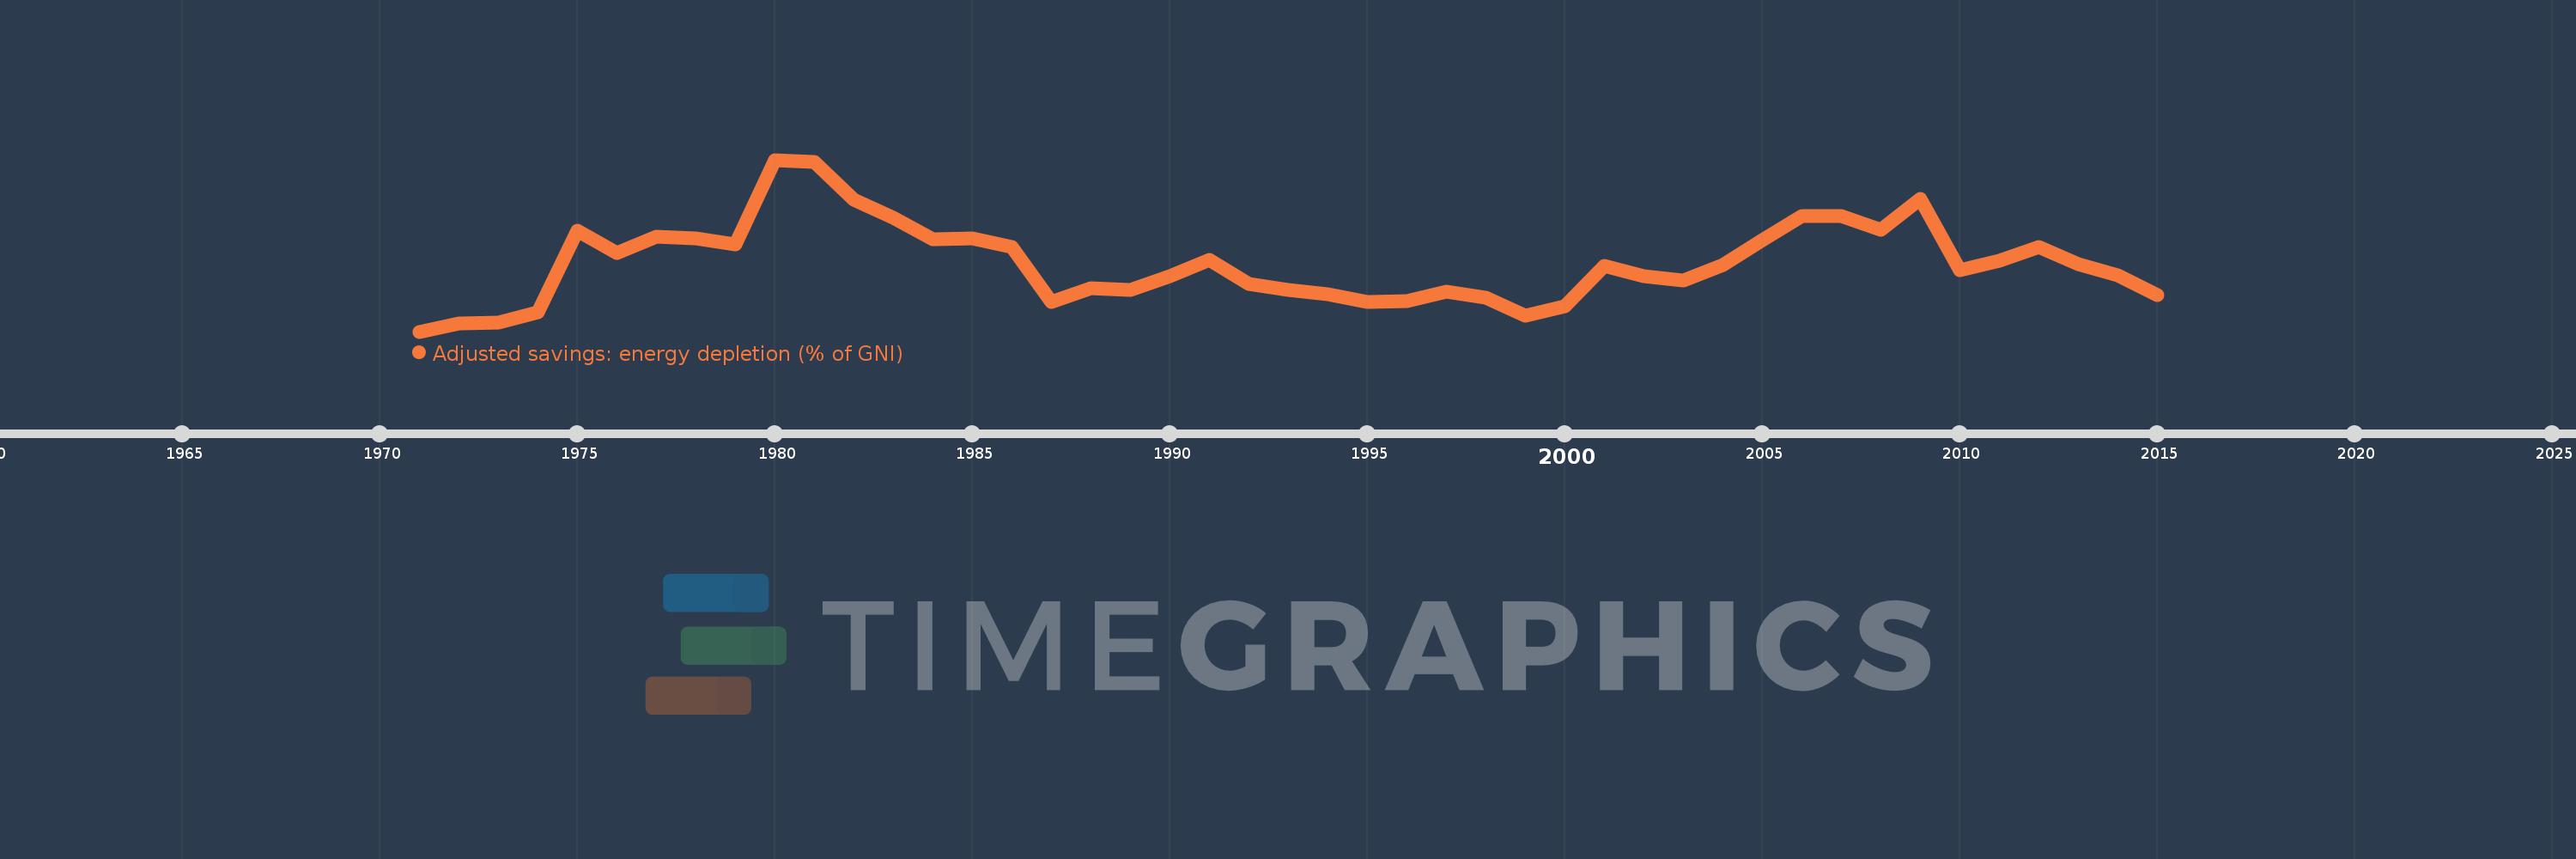
Adjusted savings: energy depletion (% of GNI)
2015,2014,2013,2012,2011,2010,2009,2008,2007,2006,2005,2004,2003,2002,2001,2000,1999,1998,1997,1996,1995,1994,1993,1992,1991,1990,1989,1988,1987,1986,1985,1984,1983,1982,1981,1980,1979,1978,1977,1976,1975,1974,1973,1972,1971
This statistics in other country:
AfghanistanAlbaniaAlgeriaAmerican SamoaAndorraAngolaAntigua and BarbudaArab WorldArgentinaArmeniaAustraliaAustriaAzerbaijanBahamas, TheBahrainBangladeshBarbadosBelarusBelgiumBelizeBeninBermudaBhutanBoliviaBosnia and HerzegovinaBotswanaBrazilBrunei DarussalamBulgariaBurkina FasoBurundiCabo VerdeCambodiaCameroonCanadaCaribbean small statesCentral African RepublicCentral Europe and the BalticsChadChannel IslandsChileChinaColombiaComorosCongo, Dem. Rep.Congo, Rep.Costa RicaCote d'IvoireCroatiaCubaCyprusCzech RepublicDenmarkDjiboutiDominicaDominican RepublicEarly-demographic dividendEast Asia & PacificEast Asia & Pacific (excluding high income)East Asia & Pacific (IDA & IBRD countries)EcuadorEgypt, Arab Rep.El SalvadorEquatorial GuineaEritreaEstoniaEthiopiaEuro areaEurope & Central AsiaEurope & Central Asia (excluding high income)Europe & Central Asia (IDA & IBRD countries)European UnionFaroe IslandsFijiFinlandFragile and conflict affected situationsFranceFrench PolynesiaGabonGambia, TheGeorgiaGermanyGhanaGreeceGreenlandGrenadaGuatemalaGuineaGuinea-BissauGuyanaHaitiHeavily indebted poor countries (HIPC)High incomeHondurasHong Kong SAR, ChinaHungaryIBRD onlyIcelandIDA & IBRD totalIDA blendIDA onlyIDA totalIndiaIndonesiaIran, Islamic Rep.IraqIrelandIsle of ManIsraelItalyJamaicaJapanJordanKazakhstanKenyaKiribatiKorea, Rep.KosovoKuwaitKyrgyz RepublicLao PDRLate-demographic dividendLatin America & Caribbean Latin America & Caribbean (excluding high income)Latin America & the Caribbean (IDA & IBRD countries)LatviaLeast developed countries: UN classificationLebanonLesothoLiberiaLibyaLiechtensteinLithuaniaLow & middle incomeLow incomeLower middle incomeLuxembourgMacao SAR, ChinaMacedonia, FYRMadagascarMalawiMalaysiaMaldivesMaliMaltaMarshall IslandsMauritaniaMauritiusMexicoMicronesia, Fed. Sts.Middle East & North AfricaMiddle East & North Africa (excluding high income)Middle East & North Africa (IDA & IBRD countries)Middle incomeMoldovaMonacoMongoliaMontenegroMoroccoMozambiqueMyanmarNamibiaNepalNetherlandsNew CaledoniaNew ZealandNicaraguaNigerNigeriaNorth AmericaNorwayOECD membersOmanOther small statesPacific island small statesPakistanPalauPanamaPapua New GuineaParaguayPeruPhilippinesPolandPortugalPost-demographic dividendPre-demographic dividendPuerto RicoQatarRomaniaRussian FederationRwandaSamoaSan MarinoSao Tome and PrincipeSaudi ArabiaSenegalSerbiaSeychellesSierra LeoneSingaporeSlovak RepublicSloveniaSmall statesSolomon IslandsSomaliaSouth AfricaSouth AsiaSouth Asia (IDA & IBRD)South SudanSpainSri LankaSt. Kitts and NevisSt. LuciaSt. Vincent and the GrenadinesSub-Saharan Africa Sub-Saharan Africa (excluding high income)Sub-Saharan Africa (IDA & IBRD countries)SudanSurinameSwazilandSwedenSwitzerlandSyrian Arab RepublicTajikistanTanzaniaThailandTimor-LesteTogoTongaTrinidad and TobagoTunisiaTurkeyTurkmenistanTuvaluUgandaUkraineUnited Arab EmiratesUnited KingdomUnited StatesUpper middle incomeUruguayUzbekistanVanuatuVenezuela, RBVietnamVirgin Islands (U.S.)West Bank and GazaWorldYemen, Rep.ZambiaZimbabwe Timeline:
This timeline shows a graph from 1971 to 2015 of Low & middle income. No data until 1970. Number of actual observations by date: 45.
Source name:
World Development Indicators
Source organization:
World Bank staff estimates based on sources and methods in World Bank's "The Changing Wealth of Nations: Measuring Sustainable Development in the New Millennium" (2011).
Categories, topics:
Economy & Growth, Energy & Mining, Environment
Last updated:
apr 23, 2017
Indicators value changes by year
At the date of observation
Value
Absolute change
Change from previous value
jan 1, 1971
0.904
+0.904
0.0%
jan 1, 1972
1.318
+0.414
45.74%
jan 1, 1973
1.35
+0.033
2.48%
jan 1, 1974
1.914
+0.564
41.76%
jan 1, 1975
6.092
+4.178
218.23%
jan 1, 1976
4.94
-1.152
-18.91%
jan 1, 1977
5.791
+0.851
17.22%
jan 1, 1978
5.725
-0.066
-1.14%
jan 1, 1979
5.386
-0.338
-5.91%
jan 1, 1980
9.75
+4.363
81.0%
jan 1, 1981
9.653
-0.097
-0.99%
jan 1, 1982
7.688
-1.965
-20.36%
jan 1, 1983
6.786
-0.902
-11.74%
jan 1, 1984
5.669
-1.116
-16.45%
jan 1, 1985
5.688
+0.019
0.33%
jan 1, 1986
5.24
-0.449
-7.89%
jan 1, 1987
2.414
-2.826
-53.93%
jan 1, 1988
3.137
+0.723
29.96%
jan 1, 1989
3.035
-0.102
-3.26%
jan 1, 1990
3.742
+0.707
23.31%
jan 1, 1991
4.606
+0.864
23.09%
jan 1, 1992
3.374
-1.233
-26.76%
jan 1, 1993
3.057
-0.317
-9.39%
jan 1, 1994
2.838
-0.22
-7.18%
jan 1, 1995
2.432
-0.406
-14.31%
jan 1, 1996
2.478
+0.046
1.91%
jan 1, 1997
2.968
+0.49
19.79%
jan 1, 1998
2.665
-0.303
-10.21%
jan 1, 1999
1.744
-0.921
-34.56%
jan 1, 2000
2.208
+0.464
26.62%
jan 1, 2001
4.298
+2.09
94.62%
jan 1, 2002
3.757
-0.541
-12.58%
jan 1, 2003
3.538
-0.22
-5.84%
jan 1, 2004
4.331
+0.793
22.41%
jan 1, 2005
5.601
+1.27
29.32%
jan 1, 2006
6.838
+1.237
22.09%
jan 1, 2007
6.84
+0.003
0.04%
jan 1, 2008
6.157
-0.683
-9.99%
jan 1, 2009
7.759
+1.602
26.02%
jan 1, 2010
4.072
-3.687
-47.52%
jan 1, 2011
4.533
+0.461
11.33%
jan 1, 2012
5.248
+0.715
15.77%
jan 1, 2013
4.39
-0.858
-16.34%
jan 1, 2014
3.793
-0.597
-13.6%
jan 1, 2015
2.762
-1.031
-27.19%
Ranking of countries by current statistics by years


Comments: