29
/
en
AIzaSyAYiBZKx7MnpbEhh9jyipgxe19OcubqV5w
April 1, 2024
135163
Gabon
GAB
true
2
1
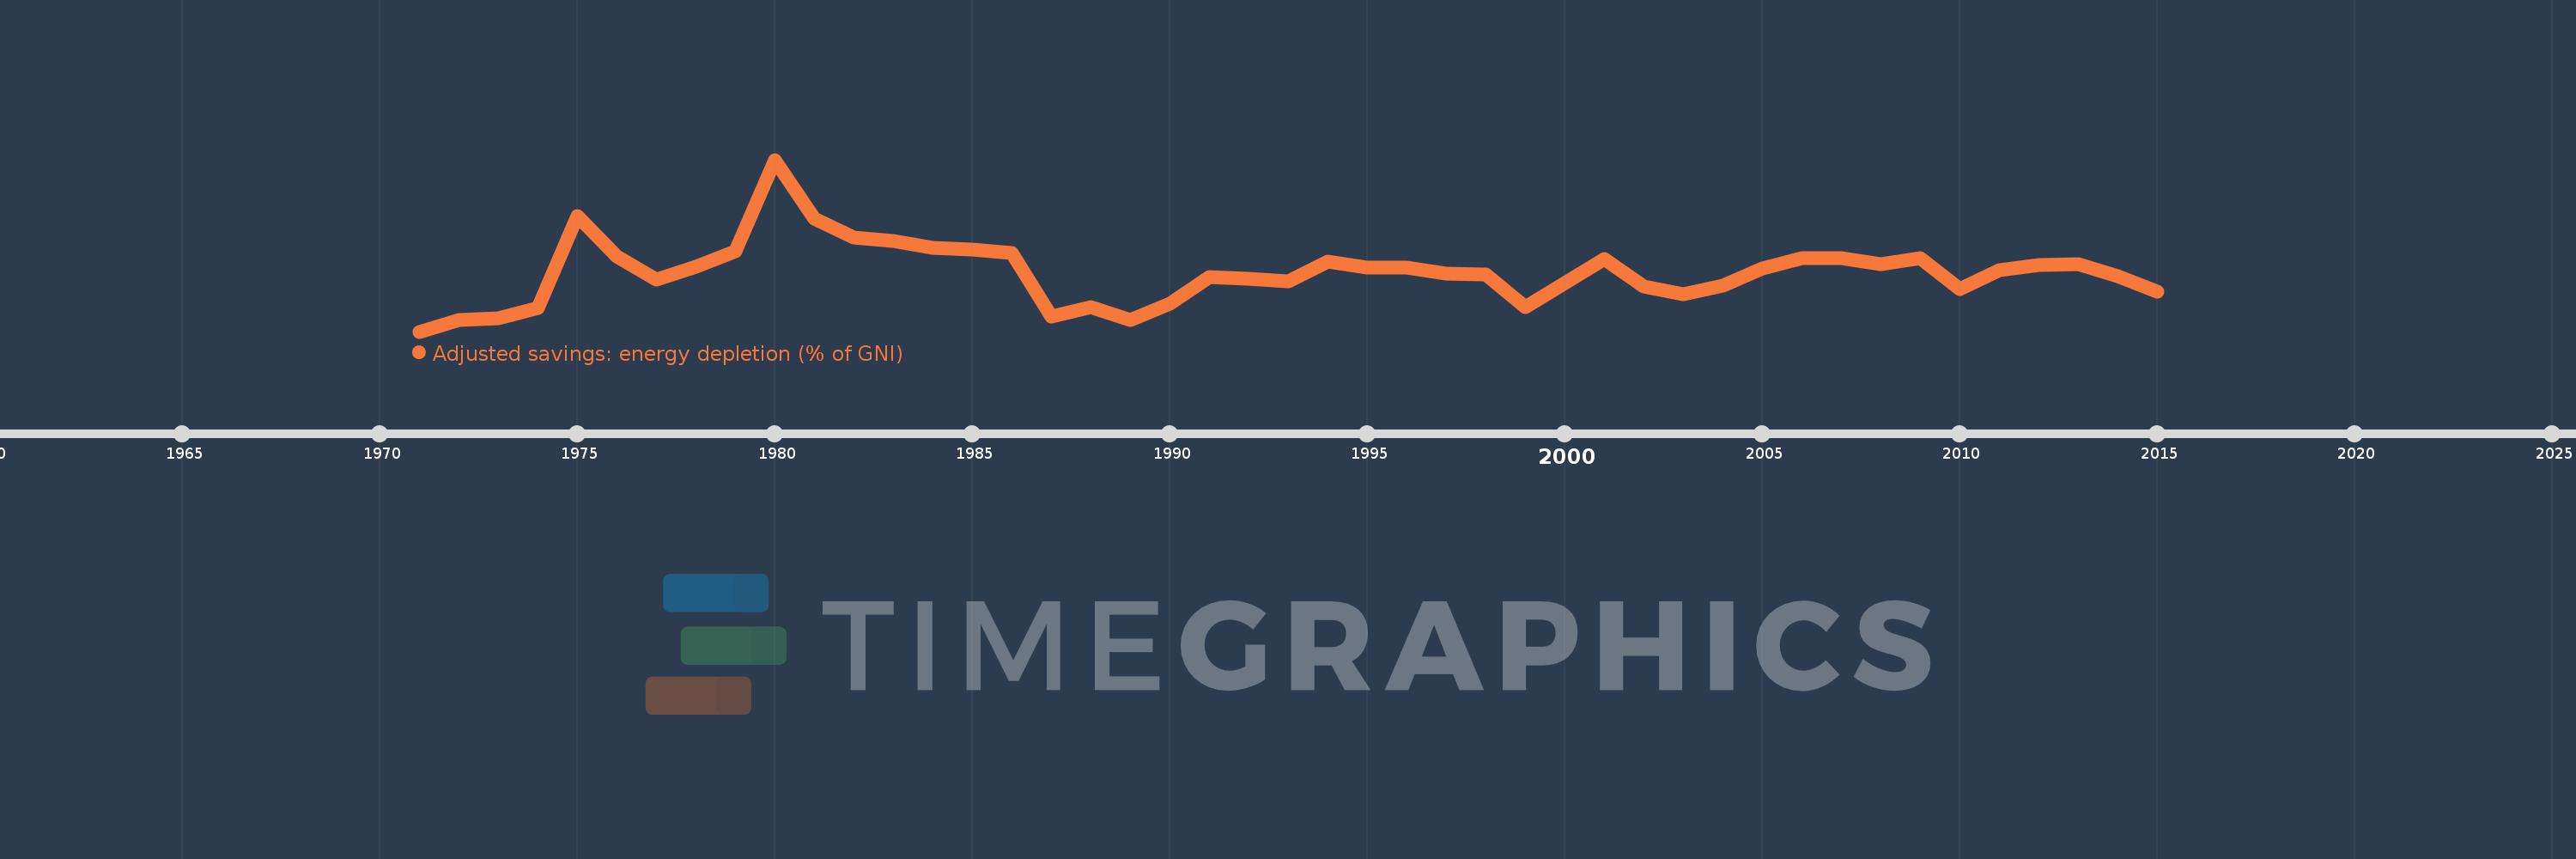
Adjusted savings: energy depletion (% of GNI)
2015,2014,2013,2012,2011,2010,2009,2008,2007,2006,2005,2004,2003,2002,2001,2000,1999,1998,1997,1996,1995,1994,1993,1992,1991,1990,1989,1988,1987,1986,1985,1984,1983,1982,1981,1980,1979,1978,1977,1976,1975,1974,1973,1972,1971
This statistics in other country:
AfghanistanAlbaniaAlgeriaAmerican SamoaAndorraAngolaAntigua and BarbudaArab WorldArgentinaArmeniaAustraliaAustriaAzerbaijanBahamas, TheBahrainBangladeshBarbadosBelarusBelgiumBelizeBeninBermudaBhutanBoliviaBosnia and HerzegovinaBotswanaBrazilBrunei DarussalamBulgariaBurkina FasoBurundiCabo VerdeCambodiaCameroonCanadaCaribbean small statesCentral African RepublicCentral Europe and the BalticsChadChannel IslandsChileChinaColombiaComorosCongo, Dem. Rep.Congo, Rep.Costa RicaCote d'IvoireCroatiaCubaCyprusCzech RepublicDenmarkDjiboutiDominicaDominican RepublicEarly-demographic dividendEast Asia & PacificEast Asia & Pacific (excluding high income)East Asia & Pacific (IDA & IBRD countries)EcuadorEgypt, Arab Rep.El SalvadorEquatorial GuineaEritreaEstoniaEthiopiaEuro areaEurope & Central AsiaEurope & Central Asia (excluding high income)Europe & Central Asia (IDA & IBRD countries)European UnionFaroe IslandsFijiFinlandFragile and conflict affected situationsFranceFrench PolynesiaGabonGambia, TheGeorgiaGermanyGhanaGreeceGreenlandGrenadaGuatemalaGuineaGuinea-BissauGuyanaHaitiHeavily indebted poor countries (HIPC)High incomeHondurasHong Kong SAR, ChinaHungaryIBRD onlyIcelandIDA & IBRD totalIDA blendIDA onlyIDA totalIndiaIndonesiaIran, Islamic Rep.IraqIrelandIsle of ManIsraelItalyJamaicaJapanJordanKazakhstanKenyaKiribatiKorea, Rep.KosovoKuwaitKyrgyz RepublicLao PDRLate-demographic dividendLatin America & Caribbean Latin America & Caribbean (excluding high income)Latin America & the Caribbean (IDA & IBRD countries)LatviaLeast developed countries: UN classificationLebanonLesothoLiberiaLibyaLiechtensteinLithuaniaLow & middle incomeLow incomeLower middle incomeLuxembourgMacao SAR, ChinaMacedonia, FYRMadagascarMalawiMalaysiaMaldivesMaliMaltaMarshall IslandsMauritaniaMauritiusMexicoMicronesia, Fed. Sts.Middle East & North AfricaMiddle East & North Africa (excluding high income)Middle East & North Africa (IDA & IBRD countries)Middle incomeMoldovaMonacoMongoliaMontenegroMoroccoMozambiqueMyanmarNamibiaNepalNetherlandsNew CaledoniaNew ZealandNicaraguaNigerNigeriaNorth AmericaNorwayOECD membersOmanOther small statesPacific island small statesPakistanPalauPanamaPapua New GuineaParaguayPeruPhilippinesPolandPortugalPost-demographic dividendPre-demographic dividendPuerto RicoQatarRomaniaRussian FederationRwandaSamoaSan MarinoSao Tome and PrincipeSaudi ArabiaSenegalSerbiaSeychellesSierra LeoneSingaporeSlovak RepublicSloveniaSmall statesSolomon IslandsSomaliaSouth AfricaSouth AsiaSouth Asia (IDA & IBRD)South SudanSpainSri LankaSt. Kitts and NevisSt. LuciaSt. Vincent and the GrenadinesSub-Saharan Africa Sub-Saharan Africa (excluding high income)Sub-Saharan Africa (IDA & IBRD countries)SudanSurinameSwazilandSwedenSwitzerlandSyrian Arab RepublicTajikistanTanzaniaThailandTimor-LesteTogoTongaTrinidad and TobagoTunisiaTurkeyTurkmenistanTuvaluUgandaUkraineUnited Arab EmiratesUnited KingdomUnited StatesUpper middle incomeUruguayUzbekistanVanuatuVenezuela, RBVietnamVirgin Islands (U.S.)West Bank and GazaWorldYemen, Rep.ZambiaZimbabwe Timeline:
This timeline shows a graph from 1971 to 2015 of Gabon. No data until 1970. Number of actual observations by date: 45.
Source name:
World Development Indicators
Source organization:
World Bank staff estimates based on sources and methods in World Bank's "The Changing Wealth of Nations: Measuring Sustainable Development in the New Millennium" (2011).
Categories, topics:
Economy & Growth, Energy & Mining, Environment
Last updated:
apr 23, 2017
Indicators value changes by year
Minimum:
11.919
jan 1, 1971
Maximum:
72.486
jan 1, 1980
At the date of observation
Value
Absolute change
Change from previous value
jan 1, 1971
11.919
+11.919
0.0%
jan 1, 1972
16.13
+4.211
35.33%
jan 1, 1973
16.622
+0.491
3.05%
jan 1, 1974
20.103
+3.481
20.94%
jan 1, 1975
52.596
+32.493
161.64%
jan 1, 1976
38.3
-14.296
-27.18%
jan 1, 1977
30.277
-8.023
-20.95%
jan 1, 1978
34.682
+4.405
14.55%
jan 1, 1979
40.281
+5.6
16.15%
jan 1, 1980
72.486
+32.204
79.95%
jan 1, 1981
51.891
-20.594
-28.41%
jan 1, 1982
45.14
-6.751
-13.01%
jan 1, 1983
43.979
-1.161
-2.57%
jan 1, 1984
41.396
-2.583
-5.87%
jan 1, 1985
40.788
-0.607
-1.47%
jan 1, 1986
39.55
-1.238
-3.04%
jan 1, 1987
17.266
-22.285
-56.35%
jan 1, 1988
20.675
+3.409
19.75%
jan 1, 1989
16.09
-4.585
-22.17%
jan 1, 1990
21.909
+5.819
36.16%
jan 1, 1991
31.249
+9.34
42.63%
jan 1, 1992
30.653
-0.597
-1.91%
jan 1, 1993
29.554
-1.098
-3.58%
jan 1, 1994
36.668
+7.114
24.07%
jan 1, 1995
34.493
-2.174
-5.93%
jan 1, 1996
34.345
-0.148
-0.43%
jan 1, 1997
32.266
-2.079
-6.05%
jan 1, 1998
31.915
-0.351
-1.09%
jan 1, 1999
20.446
-11.469
-35.94%
jan 1, 2000
28.984
+8.538
41.76%
jan 1, 2001
37.634
+8.651
29.85%
jan 1, 2002
27.833
-9.802
-26.04%
jan 1, 2003
25.194
-2.639
-9.48%
jan 1, 2004
28.161
+2.968
11.78%
jan 1, 2005
34.071
+5.909
20.98%
jan 1, 2006
37.776
+3.705
10.88%
jan 1, 2007
37.679
-0.097
-0.26%
jan 1, 2008
35.586
-2.093
-5.56%
jan 1, 2009
37.778
+2.192
6.16%
jan 1, 2010
27.037
-10.741
-28.43%
jan 1, 2011
33.599
+6.562
24.27%
jan 1, 2012
35.449
+1.85
5.5%
jan 1, 2013
35.599
+0.15
0.42%
jan 1, 2014
31.477
-4.122
-11.58%
jan 1, 2015
26.052
-5.425
-17.23%
Ranking of countries by current statistics by years


Comments: