29
/
en
AIzaSyAYiBZKx7MnpbEhh9jyipgxe19OcubqV5w
April 1, 2024
214001
Norway
NOR
true
2
1
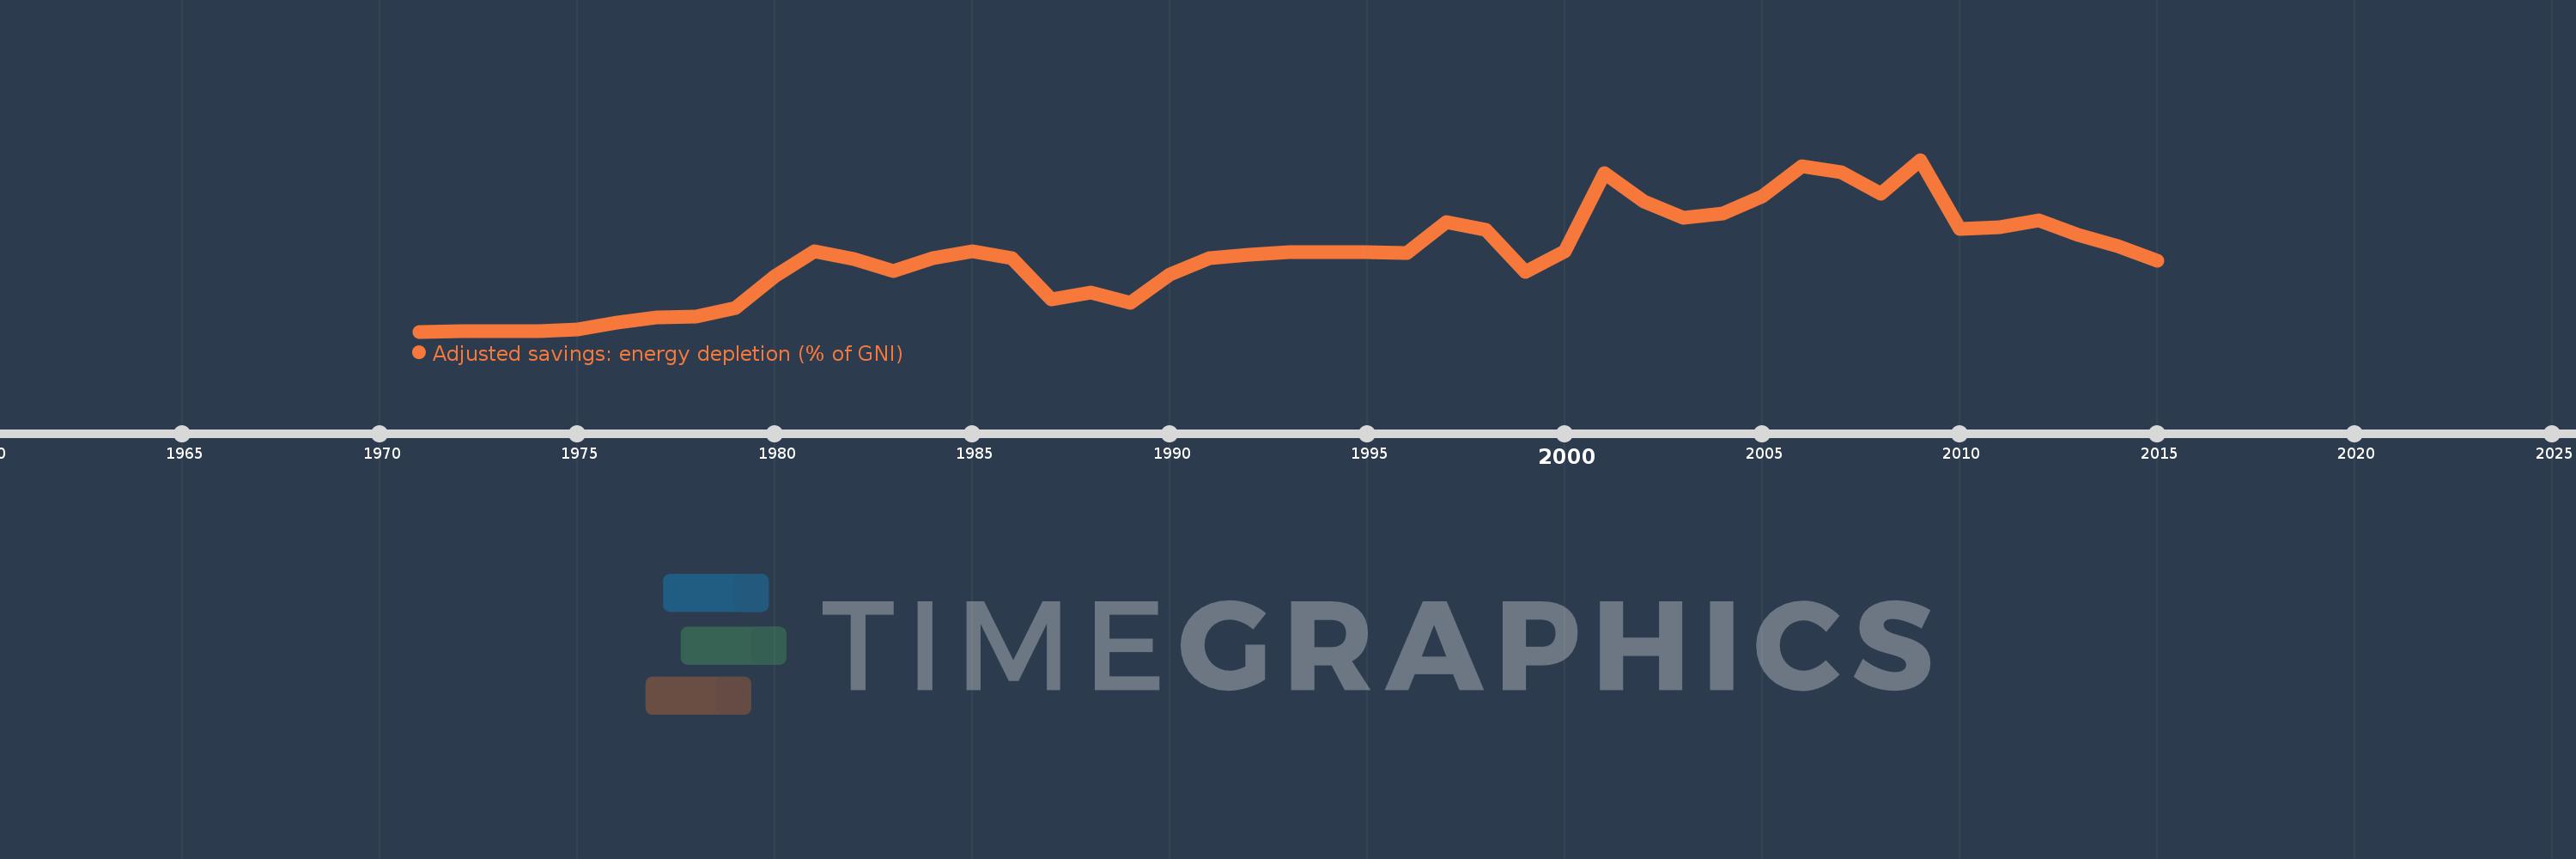
Adjusted savings: energy depletion (% of GNI)
2015,2014,2013,2012,2011,2010,2009,2008,2007,2006,2005,2004,2003,2002,2001,2000,1999,1998,1997,1996,1995,1994,1993,1992,1991,1990,1989,1988,1987,1986,1985,1984,1983,1982,1981,1980,1979,1978,1977,1976,1975,1974,1973,1972,1971
This statistics in other country:
AfghanistanAlbaniaAlgeriaAmerican SamoaAndorraAngolaAntigua and BarbudaArab WorldArgentinaArmeniaAustraliaAustriaAzerbaijanBahamas, TheBahrainBangladeshBarbadosBelarusBelgiumBelizeBeninBermudaBhutanBoliviaBosnia and HerzegovinaBotswanaBrazilBrunei DarussalamBulgariaBurkina FasoBurundiCabo VerdeCambodiaCameroonCanadaCaribbean small statesCentral African RepublicCentral Europe and the BalticsChadChannel IslandsChileChinaColombiaComorosCongo, Dem. Rep.Congo, Rep.Costa RicaCote d'IvoireCroatiaCubaCyprusCzech RepublicDenmarkDjiboutiDominicaDominican RepublicEarly-demographic dividendEast Asia & PacificEast Asia & Pacific (excluding high income)East Asia & Pacific (IDA & IBRD countries)EcuadorEgypt, Arab Rep.El SalvadorEquatorial GuineaEritreaEstoniaEthiopiaEuro areaEurope & Central AsiaEurope & Central Asia (excluding high income)Europe & Central Asia (IDA & IBRD countries)European UnionFaroe IslandsFijiFinlandFragile and conflict affected situationsFranceFrench PolynesiaGabonGambia, TheGeorgiaGermanyGhanaGreeceGreenlandGrenadaGuatemalaGuineaGuinea-BissauGuyanaHaitiHeavily indebted poor countries (HIPC)High incomeHondurasHong Kong SAR, ChinaHungaryIBRD onlyIcelandIDA & IBRD totalIDA blendIDA onlyIDA totalIndiaIndonesiaIran, Islamic Rep.IraqIrelandIsle of ManIsraelItalyJamaicaJapanJordanKazakhstanKenyaKiribatiKorea, Rep.KosovoKuwaitKyrgyz RepublicLao PDRLate-demographic dividendLatin America & Caribbean Latin America & Caribbean (excluding high income)Latin America & the Caribbean (IDA & IBRD countries)LatviaLeast developed countries: UN classificationLebanonLesothoLiberiaLibyaLiechtensteinLithuaniaLow & middle incomeLow incomeLower middle incomeLuxembourgMacao SAR, ChinaMacedonia, FYRMadagascarMalawiMalaysiaMaldivesMaliMaltaMarshall IslandsMauritaniaMauritiusMexicoMicronesia, Fed. Sts.Middle East & North AfricaMiddle East & North Africa (excluding high income)Middle East & North Africa (IDA & IBRD countries)Middle incomeMoldovaMonacoMongoliaMontenegroMoroccoMozambiqueMyanmarNamibiaNepalNetherlandsNew CaledoniaNew ZealandNicaraguaNigerNigeriaNorth AmericaNorwayOECD membersOmanOther small statesPacific island small statesPakistanPalauPanamaPapua New GuineaParaguayPeruPhilippinesPolandPortugalPost-demographic dividendPre-demographic dividendPuerto RicoQatarRomaniaRussian FederationRwandaSamoaSan MarinoSao Tome and PrincipeSaudi ArabiaSenegalSerbiaSeychellesSierra LeoneSingaporeSlovak RepublicSloveniaSmall statesSolomon IslandsSomaliaSouth AfricaSouth AsiaSouth Asia (IDA & IBRD)South SudanSpainSri LankaSt. Kitts and NevisSt. LuciaSt. Vincent and the GrenadinesSub-Saharan Africa Sub-Saharan Africa (excluding high income)Sub-Saharan Africa (IDA & IBRD countries)SudanSurinameSwazilandSwedenSwitzerlandSyrian Arab RepublicTajikistanTanzaniaThailandTimor-LesteTogoTongaTrinidad and TobagoTunisiaTurkeyTurkmenistanTuvaluUgandaUkraineUnited Arab EmiratesUnited KingdomUnited StatesUpper middle incomeUruguayUzbekistanVanuatuVenezuela, RBVietnamVirgin Islands (U.S.)West Bank and GazaWorldYemen, Rep.ZambiaZimbabwe Timeline:
This timeline shows a graph from 1971 to 2015 of Norway. No data until 1970. Number of actual observations by date: 45.
Source name:
World Development Indicators
Source organization:
World Bank staff estimates based on sources and methods in World Bank's "The Changing Wealth of Nations: Measuring Sustainable Development in the New Millennium" (2011).
Categories, topics:
Economy & Growth, Energy & Mining, Environment
Last updated:
apr 23, 2017
Indicators value changes by year
Maximum:
17.051
jan 1, 2009
At the date of observation
Value
Absolute change
Change from previous value
jan 1, 1973
0.049
+0.039
389.47%
jan 1, 1974
0.06
+0.011
22.32%
jan 1, 1975
0.224
+0.164
275.49%
jan 1, 1976
0.937
+0.713
317.93%
jan 1, 1977
1.441
+0.504
53.79%
jan 1, 1978
1.45
+0.009
0.62%
jan 1, 1979
2.344
+0.894
61.7%
jan 1, 1980
5.538
+3.193
136.22%
jan 1, 1981
7.989
+2.451
44.27%
jan 1, 1982
7.204
-0.785
-9.83%
jan 1, 1983
6.009
-1.195
-16.58%
jan 1, 1984
7.326
+1.317
21.92%
jan 1, 1985
7.957
+0.631
8.61%
jan 1, 1986
7.279
-0.677
-8.51%
jan 1, 1987
3.221
-4.058
-55.75%
jan 1, 1988
3.891
+0.67
20.79%
jan 1, 1989
2.857
-1.034
-26.58%
jan 1, 1990
5.661
+2.804
98.15%
jan 1, 1991
7.285
+1.624
28.69%
jan 1, 1992
7.622
+0.337
4.63%
jan 1, 1993
7.891
+0.269
3.53%
jan 1, 1994
7.917
+0.026
0.33%
jan 1, 1995
7.928
+0.011
0.14%
jan 1, 1996
7.787
-0.142
-1.79%
jan 1, 1997
10.873
+3.086
39.64%
jan 1, 1998
10.107
-0.766
-7.05%
jan 1, 1999
5.907
-4.2
-41.56%
jan 1, 2000
7.983
+2.076
35.15%
jan 1, 2001
15.717
+7.735
96.89%
jan 1, 2002
12.95
-2.767
-17.61%
jan 1, 2003
11.294
-1.656
-12.79%
jan 1, 2004
11.761
+0.467
4.14%
jan 1, 2005
13.465
+1.703
14.48%
jan 1, 2006
16.436
+2.971
22.07%
jan 1, 2007
15.825
-0.611
-3.72%
jan 1, 2008
13.656
-2.169
-13.71%
jan 1, 2009
17.051
+3.395
24.86%
jan 1, 2010
10.222
-6.829
-40.05%
jan 1, 2011
10.319
+0.097
0.95%
jan 1, 2012
11.003
+0.684
6.63%
jan 1, 2013
9.554
-1.449
-13.17%
jan 1, 2014
8.5
-1.054
-11.04%
jan 1, 2015
7.069
-1.431
-16.83%
Ranking of countries by current statistics by years


Comments: