29
/
en
AIzaSyAYiBZKx7MnpbEhh9jyipgxe19OcubqV5w
April 1, 2024
124409
Egypt, Arab Rep.
EGY
true
2
1
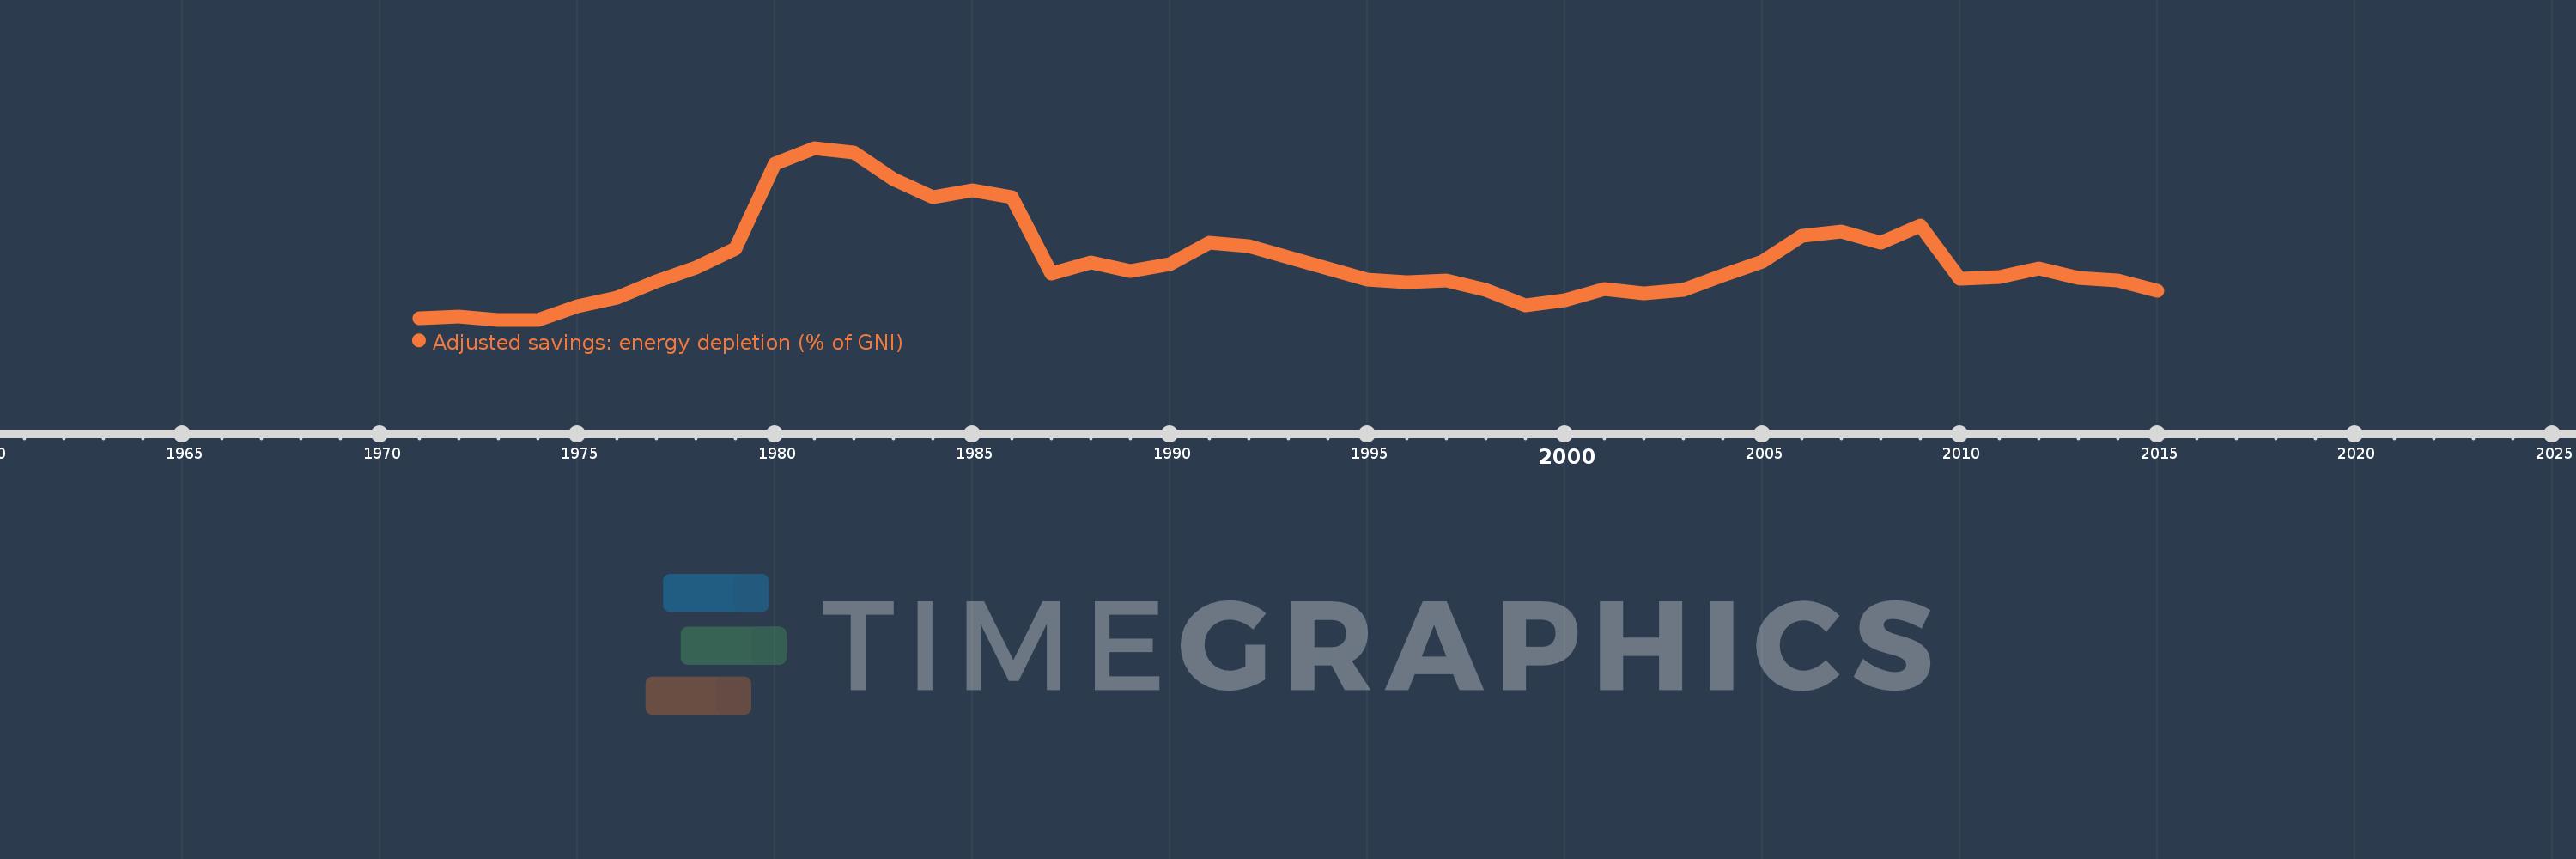
Adjusted savings: energy depletion (% of GNI)
2015,2014,2013,2012,2011,2010,2009,2008,2007,2006,2005,2004,2003,2002,2001,2000,1999,1998,1997,1996,1995,1994,1993,1992,1991,1990,1989,1988,1987,1986,1985,1984,1983,1982,1981,1980,1979,1978,1977,1976,1975,1974,1973,1972,1971
This statistics in other country:
AfghanistanAlbaniaAlgeriaAmerican SamoaAndorraAngolaAntigua and BarbudaArab WorldArgentinaArmeniaAustraliaAustriaAzerbaijanBahamas, TheBahrainBangladeshBarbadosBelarusBelgiumBelizeBeninBermudaBhutanBoliviaBosnia and HerzegovinaBotswanaBrazilBrunei DarussalamBulgariaBurkina FasoBurundiCabo VerdeCambodiaCameroonCanadaCaribbean small statesCentral African RepublicCentral Europe and the BalticsChadChannel IslandsChileChinaColombiaComorosCongo, Dem. Rep.Congo, Rep.Costa RicaCote d'IvoireCroatiaCubaCyprusCzech RepublicDenmarkDjiboutiDominicaDominican RepublicEarly-demographic dividendEast Asia & PacificEast Asia & Pacific (excluding high income)East Asia & Pacific (IDA & IBRD countries)EcuadorEgypt, Arab Rep.El SalvadorEquatorial GuineaEritreaEstoniaEthiopiaEuro areaEurope & Central AsiaEurope & Central Asia (excluding high income)Europe & Central Asia (IDA & IBRD countries)European UnionFaroe IslandsFijiFinlandFragile and conflict affected situationsFranceFrench PolynesiaGabonGambia, TheGeorgiaGermanyGhanaGreeceGreenlandGrenadaGuatemalaGuineaGuinea-BissauGuyanaHaitiHeavily indebted poor countries (HIPC)High incomeHondurasHong Kong SAR, ChinaHungaryIBRD onlyIcelandIDA & IBRD totalIDA blendIDA onlyIDA totalIndiaIndonesiaIran, Islamic Rep.IraqIrelandIsle of ManIsraelItalyJamaicaJapanJordanKazakhstanKenyaKiribatiKorea, Rep.KosovoKuwaitKyrgyz RepublicLao PDRLate-demographic dividendLatin America & Caribbean Latin America & Caribbean (excluding high income)Latin America & the Caribbean (IDA & IBRD countries)LatviaLeast developed countries: UN classificationLebanonLesothoLiberiaLibyaLiechtensteinLithuaniaLow & middle incomeLow incomeLower middle incomeLuxembourgMacao SAR, ChinaMacedonia, FYRMadagascarMalawiMalaysiaMaldivesMaliMaltaMarshall IslandsMauritaniaMauritiusMexicoMicronesia, Fed. Sts.Middle East & North AfricaMiddle East & North Africa (excluding high income)Middle East & North Africa (IDA & IBRD countries)Middle incomeMoldovaMonacoMongoliaMontenegroMoroccoMozambiqueMyanmarNamibiaNepalNetherlandsNew CaledoniaNew ZealandNicaraguaNigerNigeriaNorth AmericaNorwayOECD membersOmanOther small statesPacific island small statesPakistanPalauPanamaPapua New GuineaParaguayPeruPhilippinesPolandPortugalPost-demographic dividendPre-demographic dividendPuerto RicoQatarRomaniaRussian FederationRwandaSamoaSan MarinoSao Tome and PrincipeSaudi ArabiaSenegalSerbiaSeychellesSierra LeoneSingaporeSlovak RepublicSloveniaSmall statesSolomon IslandsSomaliaSouth AfricaSouth AsiaSouth Asia (IDA & IBRD)South SudanSpainSri LankaSt. Kitts and NevisSt. LuciaSt. Vincent and the GrenadinesSub-Saharan Africa Sub-Saharan Africa (excluding high income)Sub-Saharan Africa (IDA & IBRD countries)SudanSurinameSwazilandSwedenSwitzerlandSyrian Arab RepublicTajikistanTanzaniaThailandTimor-LesteTogoTongaTrinidad and TobagoTunisiaTurkeyTurkmenistanTuvaluUgandaUkraineUnited Arab EmiratesUnited KingdomUnited StatesUpper middle incomeUruguayUzbekistanVanuatuVenezuela, RBVietnamVirgin Islands (U.S.)West Bank and GazaWorldYemen, Rep.ZambiaZimbabwe Timeline:
This timeline shows a graph from 1971 to 2015 of Egypt, Arab Rep.. No data until 1970. Number of actual observations by date: 45.
Source name:
World Development Indicators
Source organization:
World Bank staff estimates based on sources and methods in World Bank's "The Changing Wealth of Nations: Measuring Sustainable Development in the New Millennium" (2011).
Categories, topics:
Economy & Growth, Energy & Mining, Environment
Last updated:
apr 23, 2017
Indicators value changes by year
Maximum:
28.224
jan 1, 1981
At the date of observation
Value
Absolute change
Change from previous value
jan 1, 1971
1.053
+1.053
0.0%
jan 1, 1972
1.292
+0.239
22.68%
jan 1, 1973
0.796
-0.496
-38.36%
jan 1, 1974
0.793
-0.004
-0.47%
jan 1, 1975
2.907
+2.114
266.63%
jan 1, 1976
4.305
+1.398
48.11%
jan 1, 1977
6.886
+2.581
59.96%
jan 1, 1978
9.171
+2.285
33.18%
jan 1, 1979
12.194
+3.023
32.96%
jan 1, 1980
25.656
+13.462
110.4%
jan 1, 1981
28.224
+2.568
10.01%
jan 1, 1982
27.513
-0.711
-2.52%
jan 1, 1983
23.228
-4.285
-15.57%
jan 1, 1984
20.432
-2.796
-12.04%
jan 1, 1985
21.45
+1.018
4.98%
jan 1, 1986
20.345
-1.105
-5.15%
jan 1, 1987
8.189
-12.156
-59.75%
jan 1, 1988
9.92
+1.731
21.14%
jan 1, 1989
8.558
-1.361
-13.72%
jan 1, 1990
9.679
+1.121
13.1%
jan 1, 1991
13.16
+3.48
35.96%
jan 1, 1992
12.557
-0.602
-4.58%
jan 1, 1993
10.776
-1.781
-14.18%
jan 1, 1994
8.983
-1.794
-16.65%
jan 1, 1995
7.208
-1.775
-19.76%
jan 1, 1996
6.778
-0.43
-5.96%
jan 1, 1997
7.1
+0.322
4.75%
jan 1, 1998
5.602
-1.498
-21.1%
jan 1, 1999
3.084
-2.518
-44.95%
jan 1, 2000
3.97
+0.886
28.74%
jan 1, 2001
5.749
+1.779
44.82%
jan 1, 2002
5.024
-0.725
-12.61%
jan 1, 2003
5.49
+0.466
9.27%
jan 1, 2004
7.833
+2.343
42.67%
jan 1, 2005
10.12
+2.288
29.21%
jan 1, 2006
14.22
+4.1
40.51%
jan 1, 2007
14.926
+0.706
4.96%
jan 1, 2008
13.127
-1.798
-12.05%
jan 1, 2009
15.814
+2.687
20.47%
jan 1, 2010
7.386
-8.428
-53.29%
jan 1, 2011
7.609
+0.223
3.02%
jan 1, 2012
8.926
+1.316
17.3%
jan 1, 2013
7.409
-1.516
-16.99%
jan 1, 2014
7.044
-0.366
-4.93%
jan 1, 2015
5.406
-1.638
-23.25%
Ranking of countries by current statistics by years


Comments: