29
/
en
AIzaSyAYiBZKx7MnpbEhh9jyipgxe19OcubqV5w
April 1, 2024
267593
Tunisia
TUN
true
2
1
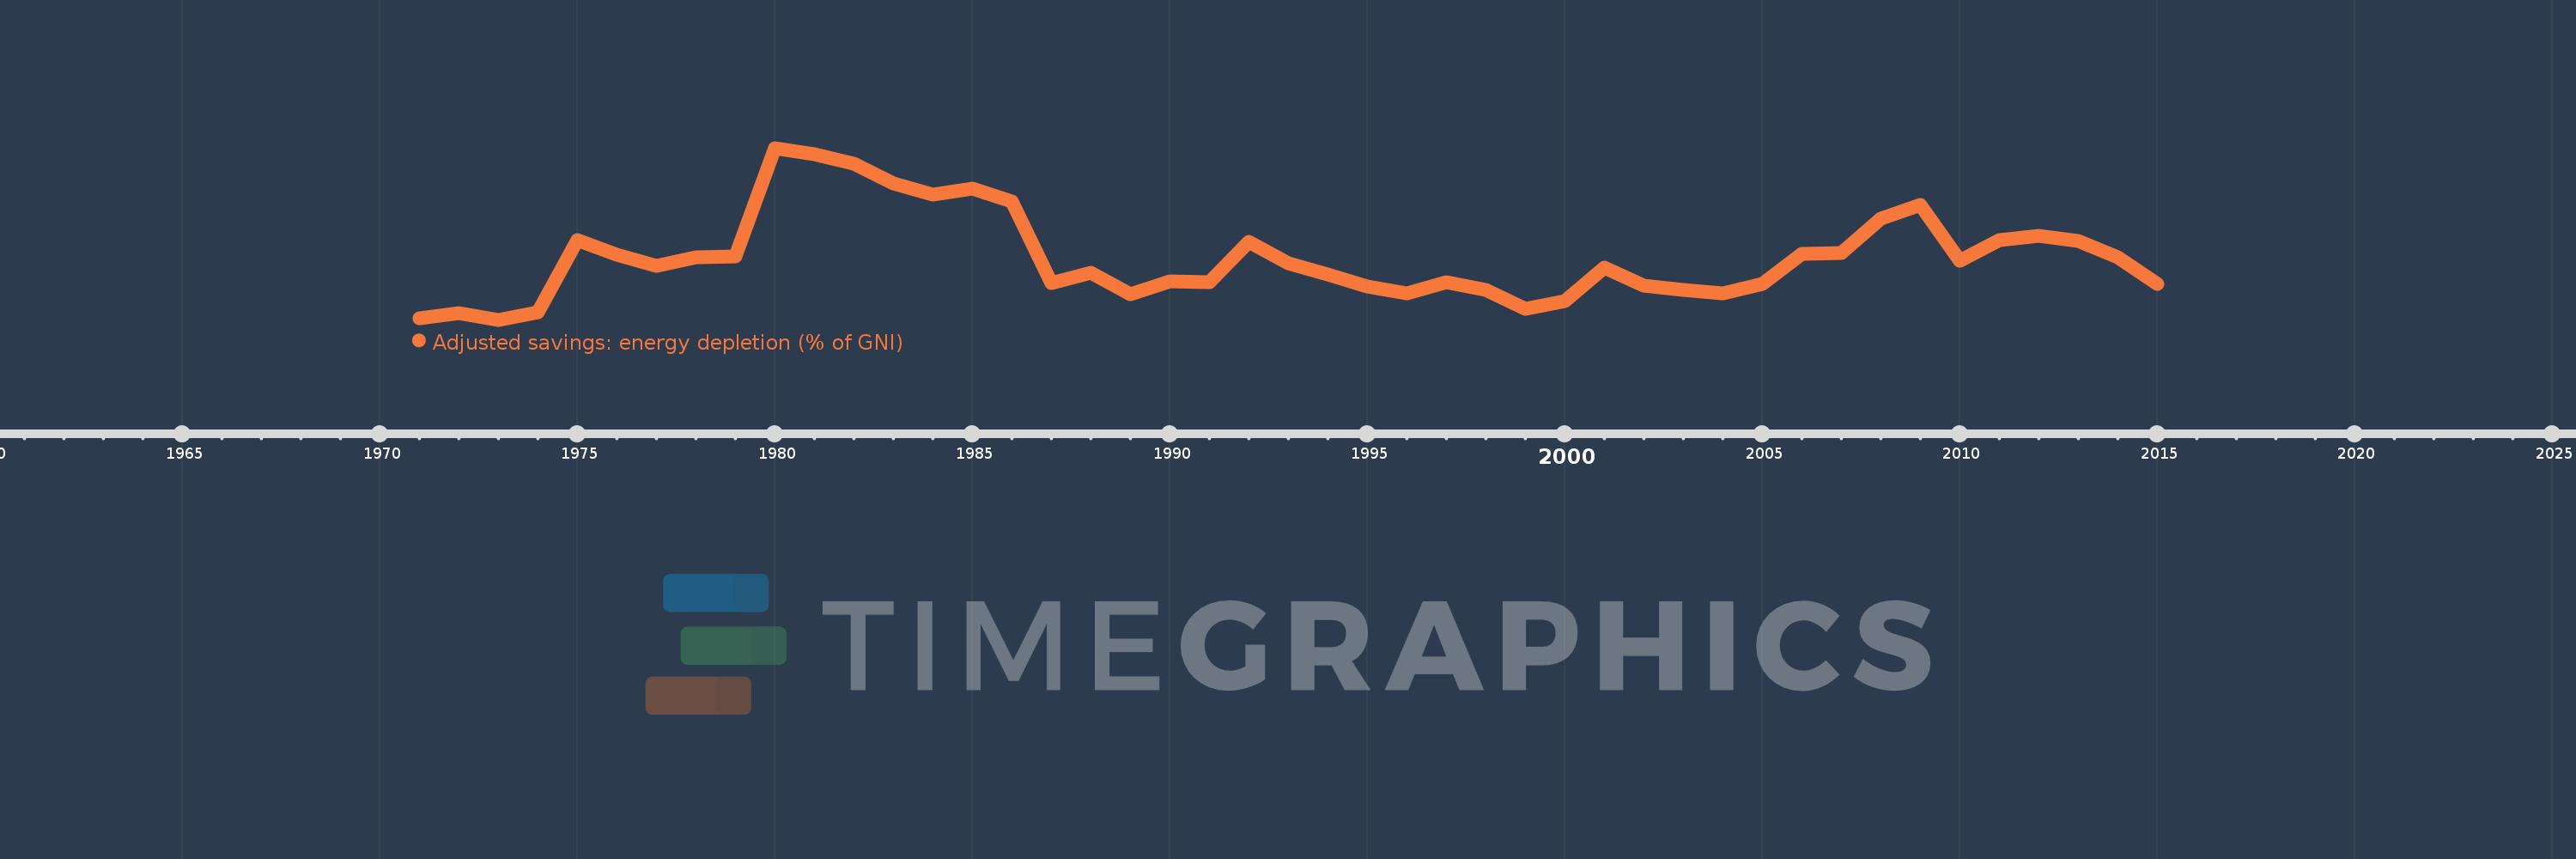
Adjusted savings: energy depletion (% of GNI)
2015,2014,2013,2012,2011,2010,2009,2008,2007,2006,2005,2004,2003,2002,2001,2000,1999,1998,1997,1996,1995,1994,1993,1992,1991,1990,1989,1988,1987,1986,1985,1984,1983,1982,1981,1980,1979,1978,1977,1976,1975,1974,1973,1972,1971
This statistics in other country:
AfghanistanAlbaniaAlgeriaAmerican SamoaAndorraAngolaAntigua and BarbudaArab WorldArgentinaArmeniaAustraliaAustriaAzerbaijanBahamas, TheBahrainBangladeshBarbadosBelarusBelgiumBelizeBeninBermudaBhutanBoliviaBosnia and HerzegovinaBotswanaBrazilBrunei DarussalamBulgariaBurkina FasoBurundiCabo VerdeCambodiaCameroonCanadaCaribbean small statesCentral African RepublicCentral Europe and the BalticsChadChannel IslandsChileChinaColombiaComorosCongo, Dem. Rep.Congo, Rep.Costa RicaCote d'IvoireCroatiaCubaCyprusCzech RepublicDenmarkDjiboutiDominicaDominican RepublicEarly-demographic dividendEast Asia & PacificEast Asia & Pacific (excluding high income)East Asia & Pacific (IDA & IBRD countries)EcuadorEgypt, Arab Rep.El SalvadorEquatorial GuineaEritreaEstoniaEthiopiaEuro areaEurope & Central AsiaEurope & Central Asia (excluding high income)Europe & Central Asia (IDA & IBRD countries)European UnionFaroe IslandsFijiFinlandFragile and conflict affected situationsFranceFrench PolynesiaGabonGambia, TheGeorgiaGermanyGhanaGreeceGreenlandGrenadaGuatemalaGuineaGuinea-BissauGuyanaHaitiHeavily indebted poor countries (HIPC)High incomeHondurasHong Kong SAR, ChinaHungaryIBRD onlyIcelandIDA & IBRD totalIDA blendIDA onlyIDA totalIndiaIndonesiaIran, Islamic Rep.IraqIrelandIsle of ManIsraelItalyJamaicaJapanJordanKazakhstanKenyaKiribatiKorea, Rep.KosovoKuwaitKyrgyz RepublicLao PDRLate-demographic dividendLatin America & Caribbean Latin America & Caribbean (excluding high income)Latin America & the Caribbean (IDA & IBRD countries)LatviaLeast developed countries: UN classificationLebanonLesothoLiberiaLibyaLiechtensteinLithuaniaLow & middle incomeLow incomeLower middle incomeLuxembourgMacao SAR, ChinaMacedonia, FYRMadagascarMalawiMalaysiaMaldivesMaliMaltaMarshall IslandsMauritaniaMauritiusMexicoMicronesia, Fed. Sts.Middle East & North AfricaMiddle East & North Africa (excluding high income)Middle East & North Africa (IDA & IBRD countries)Middle incomeMoldovaMonacoMongoliaMontenegroMoroccoMozambiqueMyanmarNamibiaNepalNetherlandsNew CaledoniaNew ZealandNicaraguaNigerNigeriaNorth AmericaNorwayOECD membersOmanOther small statesPacific island small statesPakistanPalauPanamaPapua New GuineaParaguayPeruPhilippinesPolandPortugalPost-demographic dividendPre-demographic dividendPuerto RicoQatarRomaniaRussian FederationRwandaSamoaSan MarinoSao Tome and PrincipeSaudi ArabiaSenegalSerbiaSeychellesSierra LeoneSingaporeSlovak RepublicSloveniaSmall statesSolomon IslandsSomaliaSouth AfricaSouth AsiaSouth Asia (IDA & IBRD)South SudanSpainSri LankaSt. Kitts and NevisSt. LuciaSt. Vincent and the GrenadinesSub-Saharan Africa Sub-Saharan Africa (excluding high income)Sub-Saharan Africa (IDA & IBRD countries)SudanSurinameSwazilandSwedenSwitzerlandSyrian Arab RepublicTajikistanTanzaniaThailandTimor-LesteTogoTongaTrinidad and TobagoTunisiaTurkeyTurkmenistanTuvaluUgandaUkraineUnited Arab EmiratesUnited KingdomUnited StatesUpper middle incomeUruguayUzbekistanVanuatuVenezuela, RBVietnamVirgin Islands (U.S.)West Bank and GazaWorldYemen, Rep.ZambiaZimbabwe Timeline:
This timeline shows a graph from 1971 to 2015 of Tunisia. No data until 1970. Number of actual observations by date: 45.
Source name:
World Development Indicators
Source organization:
World Bank staff estimates based on sources and methods in World Bank's "The Changing Wealth of Nations: Measuring Sustainable Development in the New Millennium" (2011).
Categories, topics:
Economy & Growth, Energy & Mining, Environment
Last updated:
apr 23, 2017
Indicators value changes by year
At the date of observation
Value
Absolute change
Change from previous value
jan 1, 1971
1.092
+1.092
0.0%
jan 1, 1972
1.338
+0.246
22.51%
jan 1, 1973
1.044
-0.294
-21.98%
jan 1, 1974
1.365
+0.32
30.69%
jan 1, 1975
4.519
+3.155
231.18%
jan 1, 1976
3.868
-0.651
-14.4%
jan 1, 1977
3.403
-0.465
-12.03%
jan 1, 1978
3.745
+0.342
10.06%
jan 1, 1979
3.796
+0.05
1.34%
jan 1, 1980
8.513
+4.718
124.3%
jan 1, 1981
8.255
-0.258
-3.04%
jan 1, 1982
7.842
-0.412
-5.0%
jan 1, 1983
6.978
-0.864
-11.02%
jan 1, 1984
6.475
-0.503
-7.21%
jan 1, 1985
6.732
+0.257
3.96%
jan 1, 1986
6.188
-0.544
-8.08%
jan 1, 1987
2.651
-3.537
-57.16%
jan 1, 1988
3.093
+0.442
16.67%
jan 1, 1989
2.157
-0.936
-30.27%
jan 1, 1990
2.716
+0.56
25.94%
jan 1, 1991
2.674
-0.042
-1.54%
jan 1, 1992
4.426
+1.751
65.49%
jan 1, 1993
3.486
-0.94
-21.23%
jan 1, 1994
3.0
-0.486
-13.95%
jan 1, 1995
2.498
-0.502
-16.73%
jan 1, 1996
2.184
-0.314
-12.56%
jan 1, 1997
2.659
+0.475
21.74%
jan 1, 1998
2.335
-0.324
-12.17%
jan 1, 1999
1.527
-0.808
-34.62%
jan 1, 2000
1.839
+0.312
20.46%
jan 1, 2001
3.327
+1.488
80.88%
jan 1, 2002
2.54
-0.788
-23.67%
jan 1, 2003
2.343
-0.197
-7.76%
jan 1, 2004
2.196
-0.147
-6.26%
jan 1, 2005
2.602
+0.406
18.48%
jan 1, 2006
3.892
+1.29
49.59%
jan 1, 2007
3.951
+0.059
1.51%
jan 1, 2008
5.446
+1.495
37.84%
jan 1, 2009
6.046
+0.6
11.02%
jan 1, 2010
3.606
-2.44
-40.35%
jan 1, 2011
4.522
+0.915
25.38%
jan 1, 2012
4.681
+0.159
3.52%
jan 1, 2013
4.45
-0.231
-4.94%
jan 1, 2014
3.769
-0.681
-15.3%
jan 1, 2015
2.588
-1.181
-31.34%
Ranking of countries by current statistics by years


Comments: