29
/
en
AIzaSyAYiBZKx7MnpbEhh9jyipgxe19OcubqV5w
April 1, 2024
87239
Bolivia
BOL
true
2
1
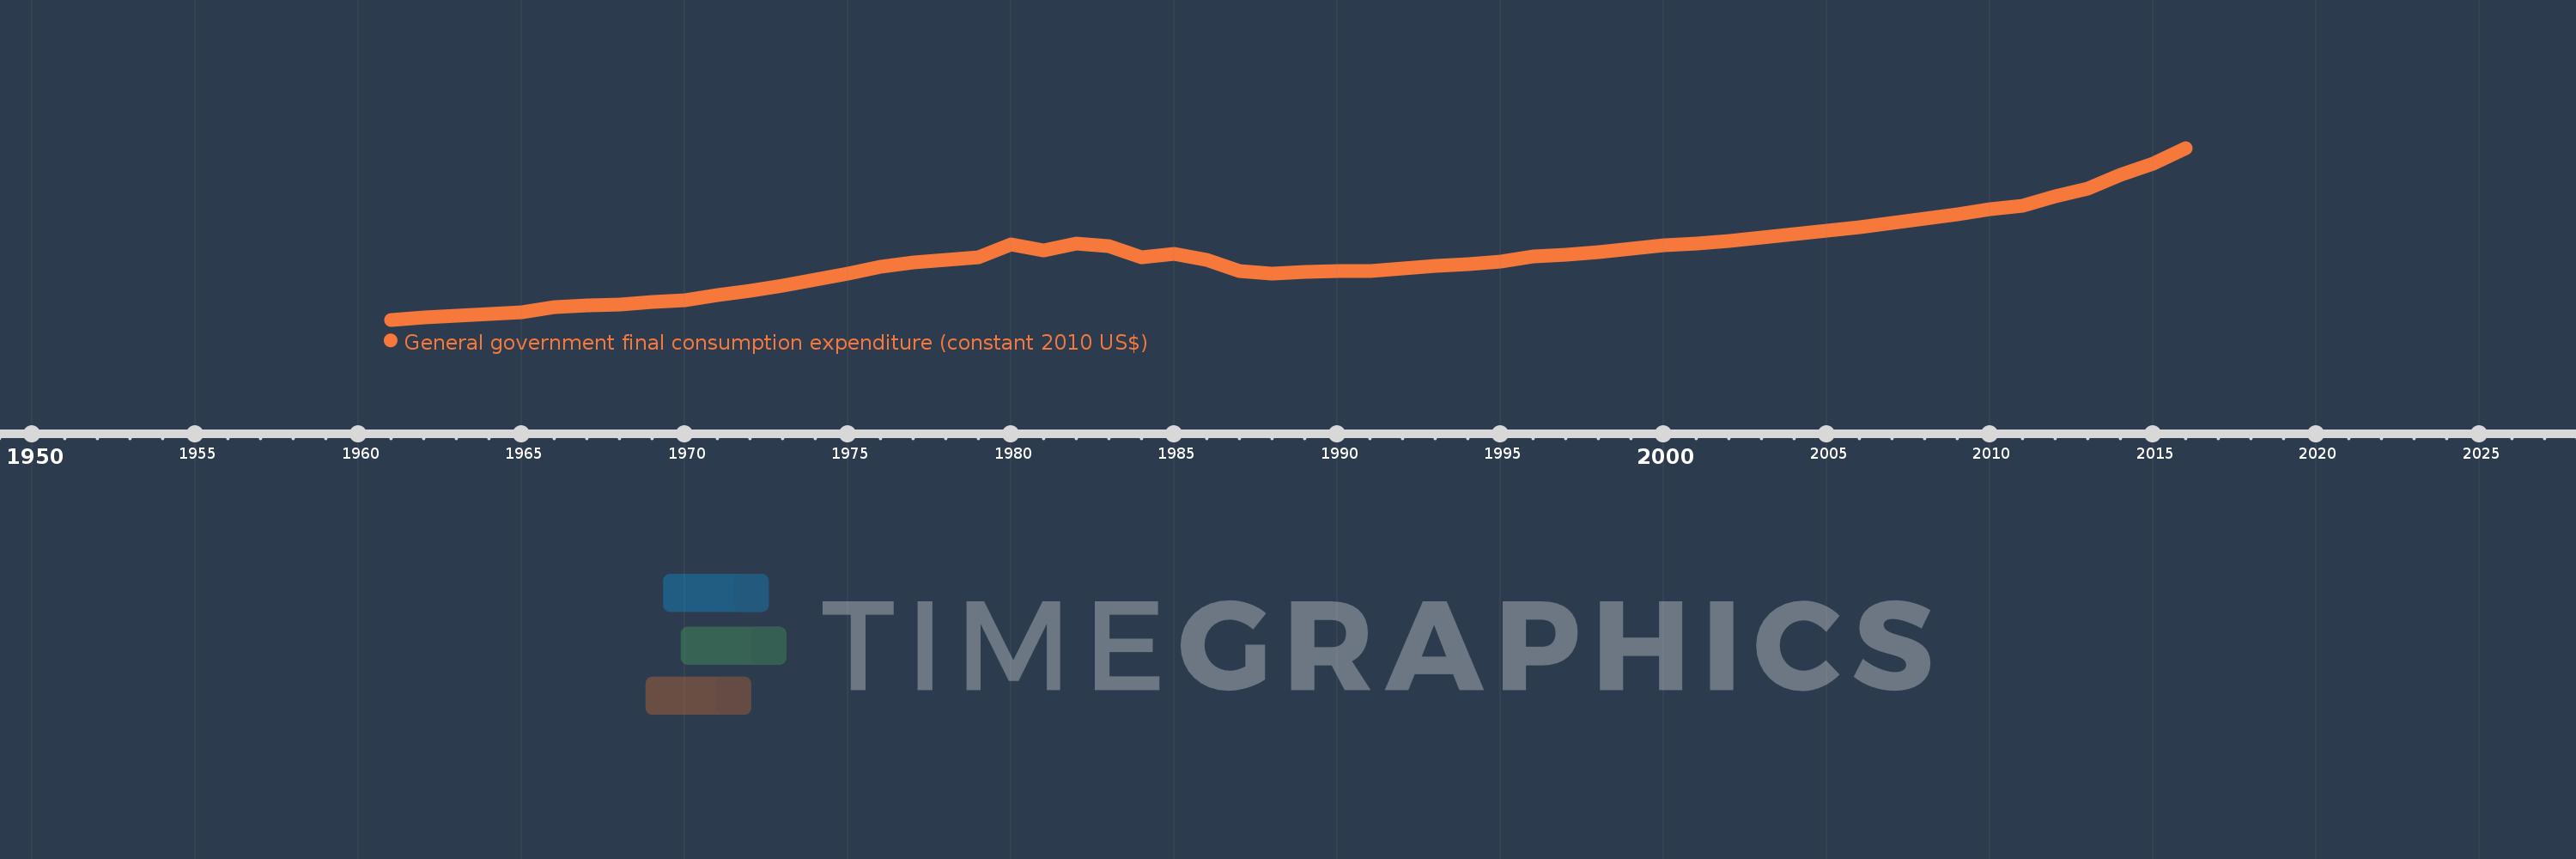
General government final consumption expenditure (constant 2010 US$)
2016,2015,2014,2013,2012,2011,2010,2009,2008,2007,2006,2005,2004,2003,2002,2001,2000,1999,1998,1997,1996,1995,1994,1993,1992,1991,1990,1989,1988,1987,1986,1985,1984,1983,1982,1981,1980,1979,1978,1977,1976,1975,1974,1973,1972,1971,1970,1969,1968,1967,1966,1965,1964,1963,1962,1961
This statistics in other country:
AfghanistanAlbaniaAlgeriaAngolaAntigua and BarbudaArab WorldArgentinaArmeniaArubaAustraliaAustriaAzerbaijanBahamas, TheBahrainBangladeshBarbadosBelarusBelgiumBelizeBeninBermudaBhutanBoliviaBosnia and HerzegovinaBotswanaBrazilBrunei DarussalamBulgariaBurkina FasoBurundiCabo VerdeCambodiaCameroonCanadaCaribbean small statesCentral African RepublicCentral Europe and the BalticsChadChileChinaColombiaComorosCongo, Dem. Rep.Congo, Rep.Costa RicaCote d'IvoireCroatiaCubaCyprusCzech RepublicDenmarkDominicaDominican RepublicEarly-demographic dividendEast Asia & PacificEast Asia & Pacific (excluding high income)East Asia & Pacific (IDA & IBRD countries)EcuadorEgypt, Arab Rep.El SalvadorEquatorial GuineaEritreaEstoniaEuro areaEurope & Central AsiaEurope & Central Asia (excluding high income)Europe & Central Asia (IDA & IBRD countries)European UnionFaroe IslandsFinlandFragile and conflict affected situationsFranceGabonGambia, TheGeorgiaGermanyGhanaGreeceGrenadaGuatemalaGuineaGuinea-BissauGuyanaHaitiHeavily indebted poor countries (HIPC)High incomeHondurasHong Kong SAR, ChinaHungaryIBRD onlyIcelandIDA & IBRD totalIDA blendIDA onlyIDA totalIndiaIndonesiaIran, Islamic Rep.IraqIrelandIsraelItalyJamaicaJapanJordanKazakhstanKenyaKorea, Rep.KosovoKuwaitKyrgyz RepublicLao PDRLate-demographic dividendLatin America & Caribbean Latin America & Caribbean (excluding high income)Latin America & the Caribbean (IDA & IBRD countries)LatviaLeast developed countries: UN classificationLebanonLiberiaLithuaniaLow & middle incomeLow incomeLower middle incomeLuxembourgMacao SAR, ChinaMacedonia, FYRMadagascarMalawiMalaysiaMaliMaltaMauritaniaMauritiusMexicoMiddle East & North AfricaMiddle East & North Africa (excluding high income)Middle East & North Africa (IDA & IBRD countries)Middle incomeMoldovaMongoliaMontenegroMoroccoMozambiqueNamibiaNepalNetherlandsNew ZealandNicaraguaNigerNigeriaNorth AmericaNorwayOECD membersOmanOther small statesPakistanPanamaParaguayPeruPhilippinesPolandPortugalPost-demographic dividendPre-demographic dividendPuerto RicoQatarRomaniaRussian FederationRwandaSaudi ArabiaSenegalSerbiaSeychellesSierra LeoneSingaporeSlovak RepublicSloveniaSmall statesSouth AfricaSouth AsiaSouth Asia (IDA & IBRD)South SudanSpainSri LankaSt. Kitts and NevisSt. LuciaSt. Vincent and the GrenadinesSub-Saharan Africa Sub-Saharan Africa (excluding high income)Sub-Saharan Africa (IDA & IBRD countries)SudanSurinameSwazilandSwedenSwitzerlandTajikistanTanzaniaThailandTimor-LesteTogoTongaTrinidad and TobagoTunisiaTurkeyTurkmenistanUgandaUkraineUnited Arab EmiratesUnited KingdomUnited StatesUpper middle incomeUruguayUzbekistanVanuatuVenezuela, RBVietnamWest Bank and GazaWorldYemen, Rep.ZambiaZimbabwe Timeline:
This timeline shows a graph from 1961 to 2016 of Bolivia. No data until 1960. Number of actual observations by date: 56.
Source name:
World Development Indicators
Source organization:
World Bank national accounts data, and OECD National Accounts data files.
Categories, topics:
Economy & Growth
Last updated:
apr 23, 2017
Indicators value changes by year
Minimum:
390.958 mln
jan 1, 1961
Maximum:
3.893 bln
jan 1, 2016
At the date of observation
Value
Absolute change
Change from previous value
jan 1, 1961
390.958 mln
+390.958 mln
0.0%
jan 1, 1962
434.647 mln
+43.689 mln
11.17%
jan 1, 1963
474.975 mln
+40.328 mln
9.28%
jan 1, 1964
511.729 mln
+36.754 mln
7.74%
jan 1, 1965
536.468 mln
+24.738 mln
4.83%
jan 1, 1966
656.625 mln
+120.157 mln
22.4%
jan 1, 1967
679.243 mln
+22.618 mln
3.44%
jan 1, 1968
701.154 mln
+21.911 mln
3.23%
jan 1, 1969
761.939 mln
+60.786 mln
8.67%
jan 1, 1970
791.625 mln
+29.686 mln
3.9%
jan 1, 1971
899.813 mln
+108.188 mln
13.67%
jan 1, 1972
979.992 mln
+80.179 mln
8.91%
jan 1, 1973
1.087 bln
+107.395 mln
10.96%
jan 1, 1974
1.216 bln
+128.513 mln
11.82%
jan 1, 1975
1.326 bln
+110.105 mln
9.06%
jan 1, 1976
1.472 bln
+146.129 mln
11.02%
jan 1, 1977
1.561 bln
+89.1 mln
6.05%
jan 1, 1978
1.609 bln
+48.22 mln
3.09%
jan 1, 1979
1.656 bln
+46.188 mln
2.87%
jan 1, 1980
1.919 bln
+263.123 mln
15.89%
jan 1, 1981
1.796 bln
-122.753 mln
-6.4%
jan 1, 1982
1.947 bln
+150.506 mln
8.38%
jan 1, 1983
1.89 bln
-56.644 mln
-2.91%
jan 1, 1984
1.668 bln
-222.06 mln
-11.75%
jan 1, 1985
1.731 bln
+63.544 mln
3.81%
jan 1, 1986
1.603 bln
-128.12 mln
-7.4%
jan 1, 1987
1.377 bln
-226.377 mln
-14.12%
jan 1, 1988
1.324 bln
-52.478 mln
-3.81%
jan 1, 1989
1.374 bln
+49.869 mln
3.77%
jan 1, 1990
1.386 bln
+12.098 mln
0.88%
jan 1, 1991
1.385 bln
-1.19 mln
-0.09%
jan 1, 1992
1.431 bln
+46.276 mln
3.34%
jan 1, 1993
1.484 bln
+52.853 mln
3.69%
jan 1, 1994
1.522 bln
+37.594 mln
2.53%
jan 1, 1995
1.57 bln
+47.671 mln
3.13%
jan 1, 1996
1.674 bln
+104.068 mln
6.63%
jan 1, 1997
1.717 bln
+43.606 mln
2.61%
jan 1, 1998
1.775 bln
+57.701 mln
3.36%
jan 1, 1999
1.842 bln
+67.461 mln
3.8%
jan 1, 2000
1.902 bln
+59.145 mln
3.21%
jan 1, 2001
1.941 bln
+39.524 mln
2.08%
jan 1, 2002
1.997 bln
+55.567 mln
2.86%
jan 1, 2003
2.066 bln
+69.025 mln
3.46%
jan 1, 2004
2.139 bln
+73.801 mln
3.57%
jan 1, 2005
2.207 bln
+67.356 mln
3.15%
jan 1, 2006
2.281 bln
+74.059 mln
3.36%
jan 1, 2007
2.356 bln
+74.662 mln
3.27%
jan 1, 2008
2.445 bln
+89.121 mln
3.78%
jan 1, 2009
2.54 bln
+95.375 mln
3.9%
jan 1, 2010
2.637 bln
+96.901 mln
3.81%
jan 1, 2011
2.718 bln
+80.878 mln
3.07%
jan 1, 2012
2.915 bln
+196.854 mln
7.24%
jan 1, 2013
3.057 bln
+142.681 mln
4.9%
jan 1, 2014
3.341 bln
+283.836 mln
9.28%
jan 1, 2015
3.565 bln
+224.322 mln
6.71%
jan 1, 2016
3.893 bln
+327.326 mln
9.18%
Ranking of countries by current statistics by years


Comments: