29
/
en
AIzaSyAYiBZKx7MnpbEhh9jyipgxe19OcubqV5w
April 1, 2024
31598
Europe & Central Asia (excluding high income)
ECA
false
2
1
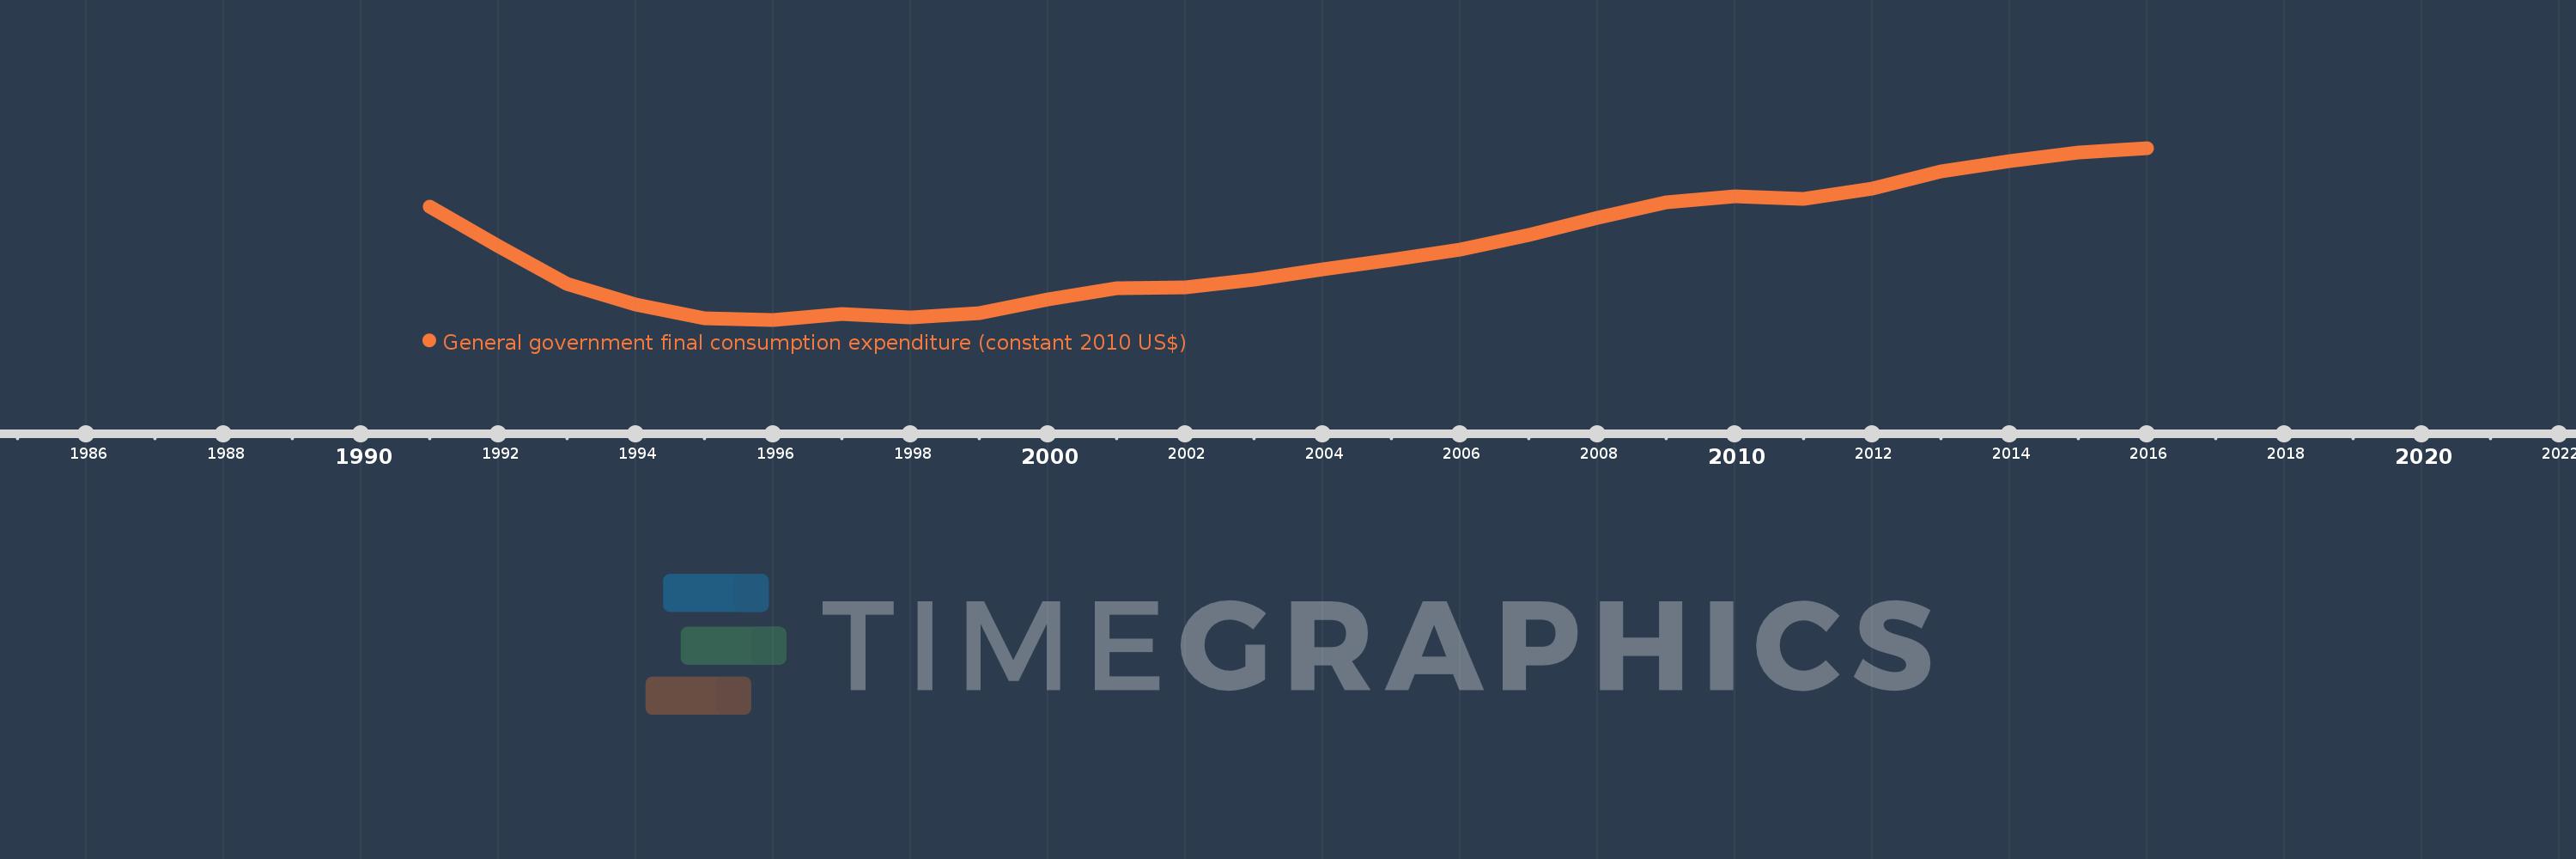
General government final consumption expenditure (constant 2010 US$)
2016,2015,2014,2013,2012,2011,2010,2009,2008,2007,2006,2005,2004,2003,2002,2001,2000,1999,1998,1997,1996,1995,1994,1993,1992,1991
This statistics in other country:
AfghanistanAlbaniaAlgeriaAngolaAntigua and BarbudaArab WorldArgentinaArmeniaArubaAustraliaAustriaAzerbaijanBahamas, TheBahrainBangladeshBarbadosBelarusBelgiumBelizeBeninBermudaBhutanBoliviaBosnia and HerzegovinaBotswanaBrazilBrunei DarussalamBulgariaBurkina FasoBurundiCabo VerdeCambodiaCameroonCanadaCaribbean small statesCentral African RepublicCentral Europe and the BalticsChadChileChinaColombiaComorosCongo, Dem. Rep.Congo, Rep.Costa RicaCote d'IvoireCroatiaCubaCyprusCzech RepublicDenmarkDominicaDominican RepublicEarly-demographic dividendEast Asia & PacificEast Asia & Pacific (excluding high income)East Asia & Pacific (IDA & IBRD countries)EcuadorEgypt, Arab Rep.El SalvadorEquatorial GuineaEritreaEstoniaEuro areaEurope & Central AsiaEurope & Central Asia (excluding high income)Europe & Central Asia (IDA & IBRD countries)European UnionFaroe IslandsFinlandFragile and conflict affected situationsFranceGabonGambia, TheGeorgiaGermanyGhanaGreeceGrenadaGuatemalaGuineaGuinea-BissauGuyanaHaitiHeavily indebted poor countries (HIPC)High incomeHondurasHong Kong SAR, ChinaHungaryIBRD onlyIcelandIDA & IBRD totalIDA blendIDA onlyIDA totalIndiaIndonesiaIran, Islamic Rep.IraqIrelandIsraelItalyJamaicaJapanJordanKazakhstanKenyaKorea, Rep.KosovoKuwaitKyrgyz RepublicLao PDRLate-demographic dividendLatin America & Caribbean Latin America & Caribbean (excluding high income)Latin America & the Caribbean (IDA & IBRD countries)LatviaLeast developed countries: UN classificationLebanonLiberiaLithuaniaLow & middle incomeLow incomeLower middle incomeLuxembourgMacao SAR, ChinaMacedonia, FYRMadagascarMalawiMalaysiaMaliMaltaMauritaniaMauritiusMexicoMiddle East & North AfricaMiddle East & North Africa (excluding high income)Middle East & North Africa (IDA & IBRD countries)Middle incomeMoldovaMongoliaMontenegroMoroccoMozambiqueNamibiaNepalNetherlandsNew ZealandNicaraguaNigerNigeriaNorth AmericaNorwayOECD membersOmanOther small statesPakistanPanamaParaguayPeruPhilippinesPolandPortugalPost-demographic dividendPre-demographic dividendPuerto RicoQatarRomaniaRussian FederationRwandaSaudi ArabiaSenegalSerbiaSeychellesSierra LeoneSingaporeSlovak RepublicSloveniaSmall statesSouth AfricaSouth AsiaSouth Asia (IDA & IBRD)South SudanSpainSri LankaSt. Kitts and NevisSt. LuciaSt. Vincent and the GrenadinesSub-Saharan Africa Sub-Saharan Africa (excluding high income)Sub-Saharan Africa (IDA & IBRD countries)SudanSurinameSwazilandSwedenSwitzerlandTajikistanTanzaniaThailandTimor-LesteTogoTongaTrinidad and TobagoTunisiaTurkeyTurkmenistanUgandaUkraineUnited Arab EmiratesUnited KingdomUnited StatesUpper middle incomeUruguayUzbekistanVanuatuVenezuela, RBVietnamWest Bank and GazaWorldYemen, Rep.ZambiaZimbabwe Timeline:
This timeline shows a graph from 1991 to 2016 of Europe & Central Asia (excluding high income). No data until 1990. Number of actual observations by date: 26.
Source name:
World Development Indicators
Source organization:
World Bank national accounts data, and OECD National Accounts data files.
Categories, topics:
Economy & Growth
Last updated:
apr 23, 2017
Indicators value changes by year
Minimum:
389.832 bln
jan 1, 1996
Maximum:
567.859 bln
jan 1, 2016
At the date of observation
Value
Absolute change
Change from previous value
jan 1, 1991
506.711 bln
+506.711 bln
0.0%
jan 1, 1992
465.99 bln
-40.721 bln
-8.04%
jan 1, 1993
426.516 bln
-39.475 bln
-8.47%
jan 1, 1994
405.826 bln
-20.69 bln
-4.85%
jan 1, 1995
391.056 bln
-14.77 bln
-3.64%
jan 1, 1996
389.832 bln
-1.224 bln
-0.31%
jan 1, 1997
395.827 bln
+5.995 bln
1.54%
jan 1, 1998
392.121 bln
-3.706 bln
-0.94%
jan 1, 1999
396.68 bln
+4.559 bln
1.16%
jan 1, 2000
410.932 bln
+14.252 bln
3.59%
jan 1, 2001
422.462 bln
+11.529 bln
2.81%
jan 1, 2002
423.765 bln
+1.304 bln
0.31%
jan 1, 2003
431.587 bln
+7.822 bln
1.85%
jan 1, 2004
441.937 bln
+10.351 bln
2.4%
jan 1, 2005
452.187 bln
+10.25 bln
2.32%
jan 1, 2006
462.203 bln
+10.015 bln
2.21%
jan 1, 2007
478.08 bln
+15.878 bln
3.44%
jan 1, 2008
495.325 bln
+17.245 bln
3.61%
jan 1, 2009
511.568 bln
+16.243 bln
3.28%
jan 1, 2010
517.634 bln
+6.066 bln
1.19%
jan 1, 2011
514.819 bln
-2.814 bln
-0.54%
jan 1, 2012
525.706 bln
+10.886 bln
2.11%
jan 1, 2013
543.629 bln
+17.923 bln
3.41%
jan 1, 2014
553.978 bln
+10.349 bln
1.9%
jan 1, 2015
563.395 bln
+9.417 bln
1.7%
jan 1, 2016
567.859 bln
+4.464 bln
0.79%
Ranking of countries by current statistics by years


Comments: