29
/
en
AIzaSyAYiBZKx7MnpbEhh9jyipgxe19OcubqV5w
April 1, 2024
207950
Netherlands
NLD
true
2
1
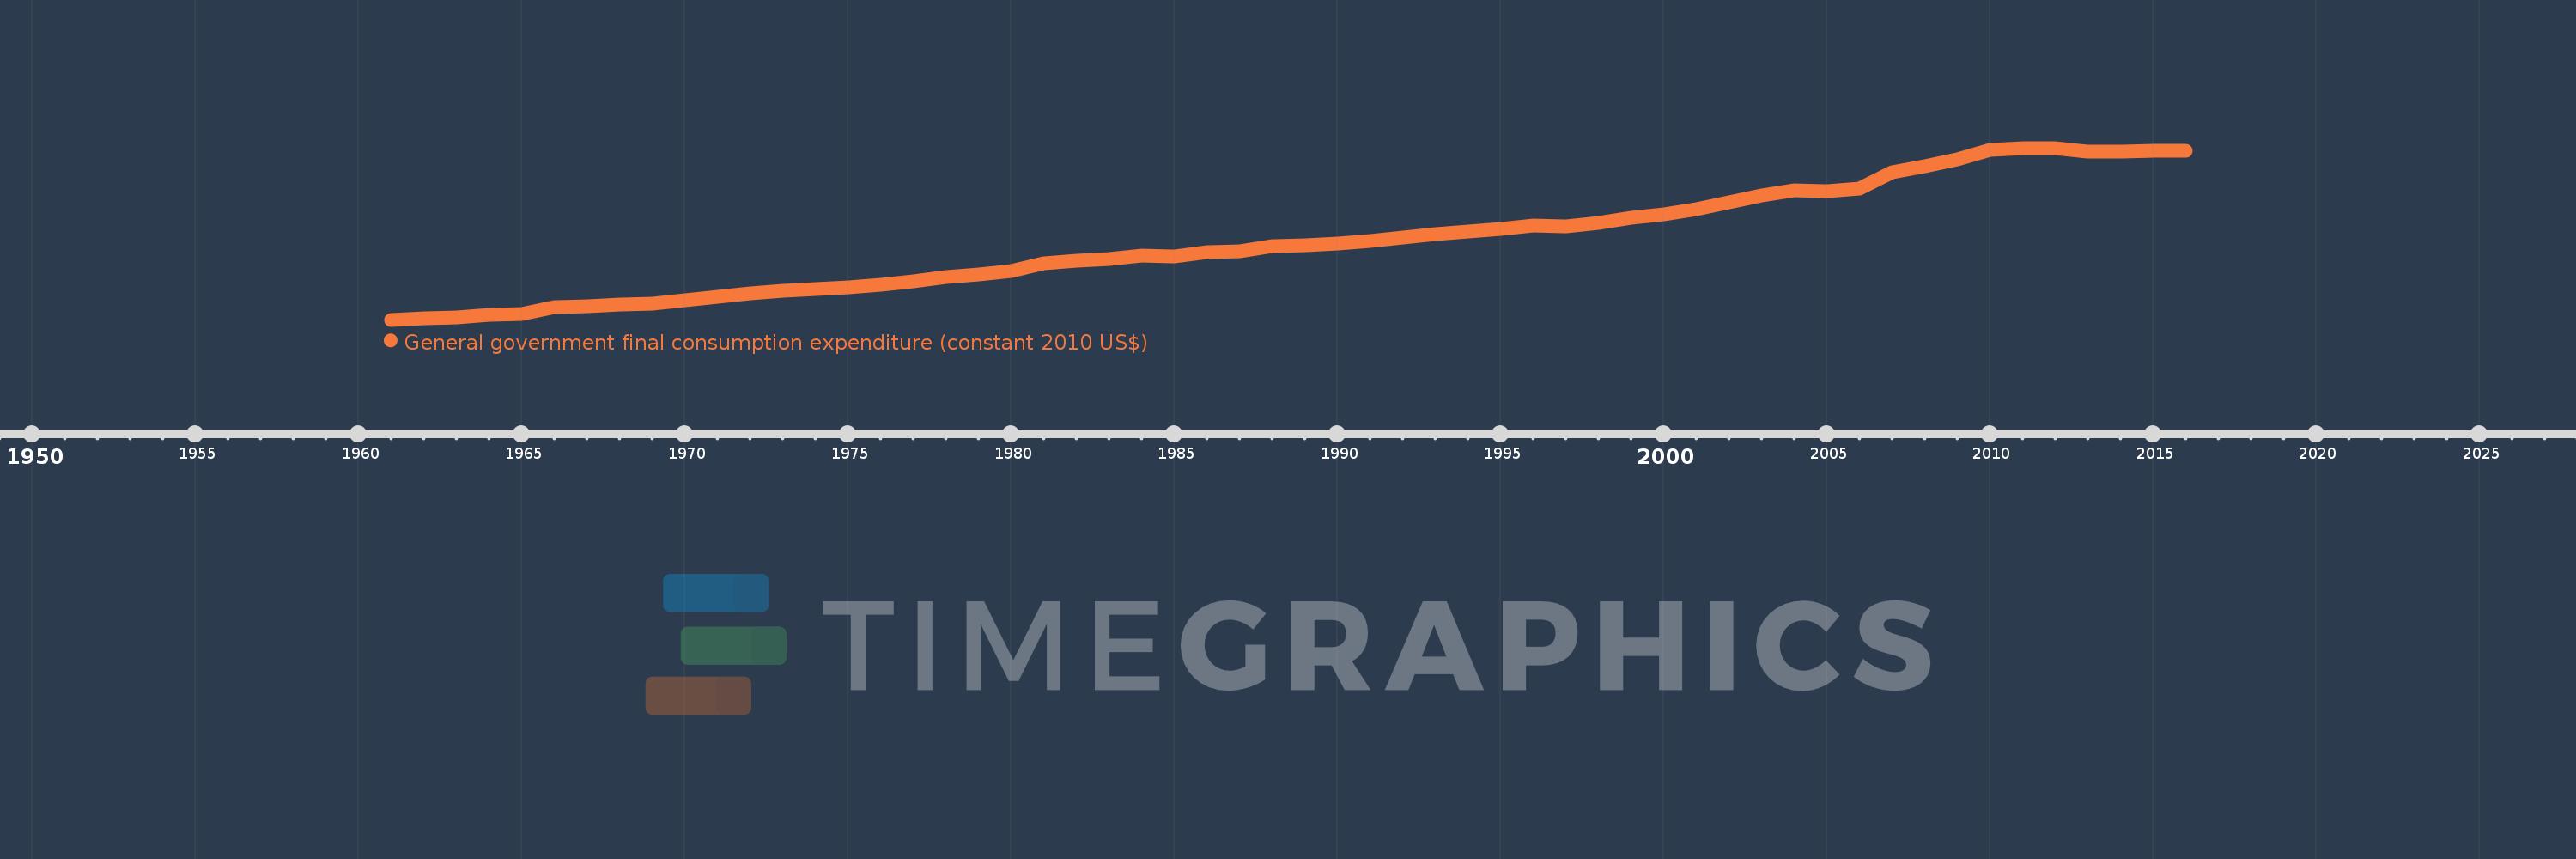
General government final consumption expenditure (constant 2010 US$)
2016,2015,2014,2013,2012,2011,2010,2009,2008,2007,2006,2005,2004,2003,2002,2001,2000,1999,1998,1997,1996,1995,1994,1993,1992,1991,1990,1989,1988,1987,1986,1985,1984,1983,1982,1981,1980,1979,1978,1977,1976,1975,1974,1973,1972,1971,1970,1969,1968,1967,1966,1965,1964,1963,1962,1961
This statistics in other country:
AfghanistanAlbaniaAlgeriaAngolaAntigua and BarbudaArab WorldArgentinaArmeniaArubaAustraliaAustriaAzerbaijanBahamas, TheBahrainBangladeshBarbadosBelarusBelgiumBelizeBeninBermudaBhutanBoliviaBosnia and HerzegovinaBotswanaBrazilBrunei DarussalamBulgariaBurkina FasoBurundiCabo VerdeCambodiaCameroonCanadaCaribbean small statesCentral African RepublicCentral Europe and the BalticsChadChileChinaColombiaComorosCongo, Dem. Rep.Congo, Rep.Costa RicaCote d'IvoireCroatiaCubaCyprusCzech RepublicDenmarkDominicaDominican RepublicEarly-demographic dividendEast Asia & PacificEast Asia & Pacific (excluding high income)East Asia & Pacific (IDA & IBRD countries)EcuadorEgypt, Arab Rep.El SalvadorEquatorial GuineaEritreaEstoniaEuro areaEurope & Central AsiaEurope & Central Asia (excluding high income)Europe & Central Asia (IDA & IBRD countries)European UnionFaroe IslandsFinlandFragile and conflict affected situationsFranceGabonGambia, TheGeorgiaGermanyGhanaGreeceGrenadaGuatemalaGuineaGuinea-BissauGuyanaHaitiHeavily indebted poor countries (HIPC)High incomeHondurasHong Kong SAR, ChinaHungaryIBRD onlyIcelandIDA & IBRD totalIDA blendIDA onlyIDA totalIndiaIndonesiaIran, Islamic Rep.IraqIrelandIsraelItalyJamaicaJapanJordanKazakhstanKenyaKorea, Rep.KosovoKuwaitKyrgyz RepublicLao PDRLate-demographic dividendLatin America & Caribbean Latin America & Caribbean (excluding high income)Latin America & the Caribbean (IDA & IBRD countries)LatviaLeast developed countries: UN classificationLebanonLiberiaLithuaniaLow & middle incomeLow incomeLower middle incomeLuxembourgMacao SAR, ChinaMacedonia, FYRMadagascarMalawiMalaysiaMaliMaltaMauritaniaMauritiusMexicoMiddle East & North AfricaMiddle East & North Africa (excluding high income)Middle East & North Africa (IDA & IBRD countries)Middle incomeMoldovaMongoliaMontenegroMoroccoMozambiqueNamibiaNepalNetherlandsNew ZealandNicaraguaNigerNigeriaNorth AmericaNorwayOECD membersOmanOther small statesPakistanPanamaParaguayPeruPhilippinesPolandPortugalPost-demographic dividendPre-demographic dividendPuerto RicoQatarRomaniaRussian FederationRwandaSaudi ArabiaSenegalSerbiaSeychellesSierra LeoneSingaporeSlovak RepublicSloveniaSmall statesSouth AfricaSouth AsiaSouth Asia (IDA & IBRD)South SudanSpainSri LankaSt. Kitts and NevisSt. LuciaSt. Vincent and the GrenadinesSub-Saharan Africa Sub-Saharan Africa (excluding high income)Sub-Saharan Africa (IDA & IBRD countries)SudanSurinameSwazilandSwedenSwitzerlandTajikistanTanzaniaThailandTimor-LesteTogoTongaTrinidad and TobagoTunisiaTurkeyTurkmenistanUgandaUkraineUnited Arab EmiratesUnited KingdomUnited StatesUpper middle incomeUruguayUzbekistanVanuatuVenezuela, RBVietnamWest Bank and GazaWorldYemen, Rep.ZambiaZimbabwe Timeline:
This timeline shows a graph from 1961 to 2016 of Netherlands. No data until 1960. Number of actual observations by date: 56.
Source name:
World Development Indicators
Source organization:
World Bank national accounts data, and OECD National Accounts data files.
Categories, topics:
Economy & Growth
Last updated:
apr 23, 2017
Indicators value changes by year
Minimum:
44.335 bln
jan 1, 1961
Maximum:
221.499 bln
jan 1, 2011
At the date of observation
Value
Absolute change
Change from previous value
jan 1, 1961
44.335 bln
+44.335 bln
0.0%
jan 1, 1962
45.59 bln
+1.255 bln
2.83%
jan 1, 1963
47.109 bln
+1.519 bln
3.33%
jan 1, 1964
49.334 bln
+2.225 bln
4.72%
jan 1, 1965
50.182 bln
+848.485 mln
1.72%
jan 1, 1966
57.598 bln
+7.415 bln
14.78%
jan 1, 1967
58.595 bln
+997.149 mln
1.73%
jan 1, 1968
59.992 bln
+1.397 bln
2.38%
jan 1, 1969
61.311 bln
+1.318 bln
2.2%
jan 1, 1970
64.066 bln
+2.755 bln
4.49%
jan 1, 1971
67.934 bln
+3.868 bln
6.04%
jan 1, 1972
71.606 bln
+3.672 bln
5.41%
jan 1, 1973
74.059 bln
+2.453 bln
3.43%
jan 1, 1974
75.59 bln
+1.53 bln
2.07%
jan 1, 1975
77.452 bln
+1.862 bln
2.46%
jan 1, 1976
80.329 bln
+2.877 bln
3.71%
jan 1, 1977
84.073 bln
+3.744 bln
4.66%
jan 1, 1978
88.123 bln
+4.049 bln
4.82%
jan 1, 1979
90.774 bln
+2.652 bln
3.01%
jan 1, 1980
94.168 bln
+3.394 bln
3.74%
jan 1, 1981
102.55 bln
+8.382 bln
8.9%
jan 1, 1982
105.107 bln
+2.556 bln
2.49%
jan 1, 1983
106.988 bln
+1.881 bln
1.79%
jan 1, 1984
110.227 bln
+3.24 bln
3.03%
jan 1, 1985
109.532 bln
-695.569 mln
-0.63%
jan 1, 1986
113.816 bln
+4.284 bln
3.91%
jan 1, 1987
115.351 bln
+1.535 bln
1.35%
jan 1, 1988
119.877 bln
+4.526 bln
3.92%
jan 1, 1989
121.326 bln
+1.449 bln
1.21%
jan 1, 1990
123.137 bln
+1.812 bln
1.49%
jan 1, 1991
125.886 bln
+2.748 bln
2.23%
jan 1, 1992
129.143 bln
+3.257 bln
2.59%
jan 1, 1993
132.431 bln
+3.288 bln
2.55%
jan 1, 1994
135.311 bln
+2.88 bln
2.18%
jan 1, 1995
138.081 bln
+2.77 bln
2.05%
jan 1, 1996
141.545 bln
+3.463 bln
2.51%
jan 1, 1997
140.261 bln
-1.283 bln
-0.91%
jan 1, 1998
144.283 bln
+4.022 bln
2.87%
jan 1, 1999
149.591 bln
+5.307 bln
3.68%
jan 1, 2000
152.945 bln
+3.355 bln
2.24%
jan 1, 2001
158.341 bln
+5.395 bln
3.53%
jan 1, 2002
165.282 bln
+6.941 bln
4.38%
jan 1, 2003
172.572 bln
+7.29 bln
4.41%
jan 1, 2004
177.733 bln
+5.161 bln
2.99%
jan 1, 2005
177.021 bln
-711.476 mln
-0.4%
jan 1, 2006
179.889 bln
+2.868 bln
1.62%
jan 1, 2007
196.694 bln
+16.805 bln
9.34%
jan 1, 2008
202.8 bln
+6.106 bln
3.1%
jan 1, 2009
209.504 bln
+6.704 bln
3.31%
jan 1, 2010
219.259 bln
+9.755 bln
4.66%
jan 1, 2011
221.499 bln
+2.24 bln
1.02%
jan 1, 2012
220.951 bln
-548.344 mln
-0.25%
jan 1, 2013
218.051 bln
-2.9 bln
-1.31%
jan 1, 2014
217.821 bln
-229.764 mln
-0.11%
jan 1, 2015
218.379 bln
+557.801 mln
0.26%
jan 1, 2016
218.898 bln
+519.327 mln
0.24%
Ranking of countries by current statistics by years


Comments: