29
/
en
AIzaSyAYiBZKx7MnpbEhh9jyipgxe19OcubqV5w
April 1, 2024
93577
Bulgaria
BGR
true
2
1
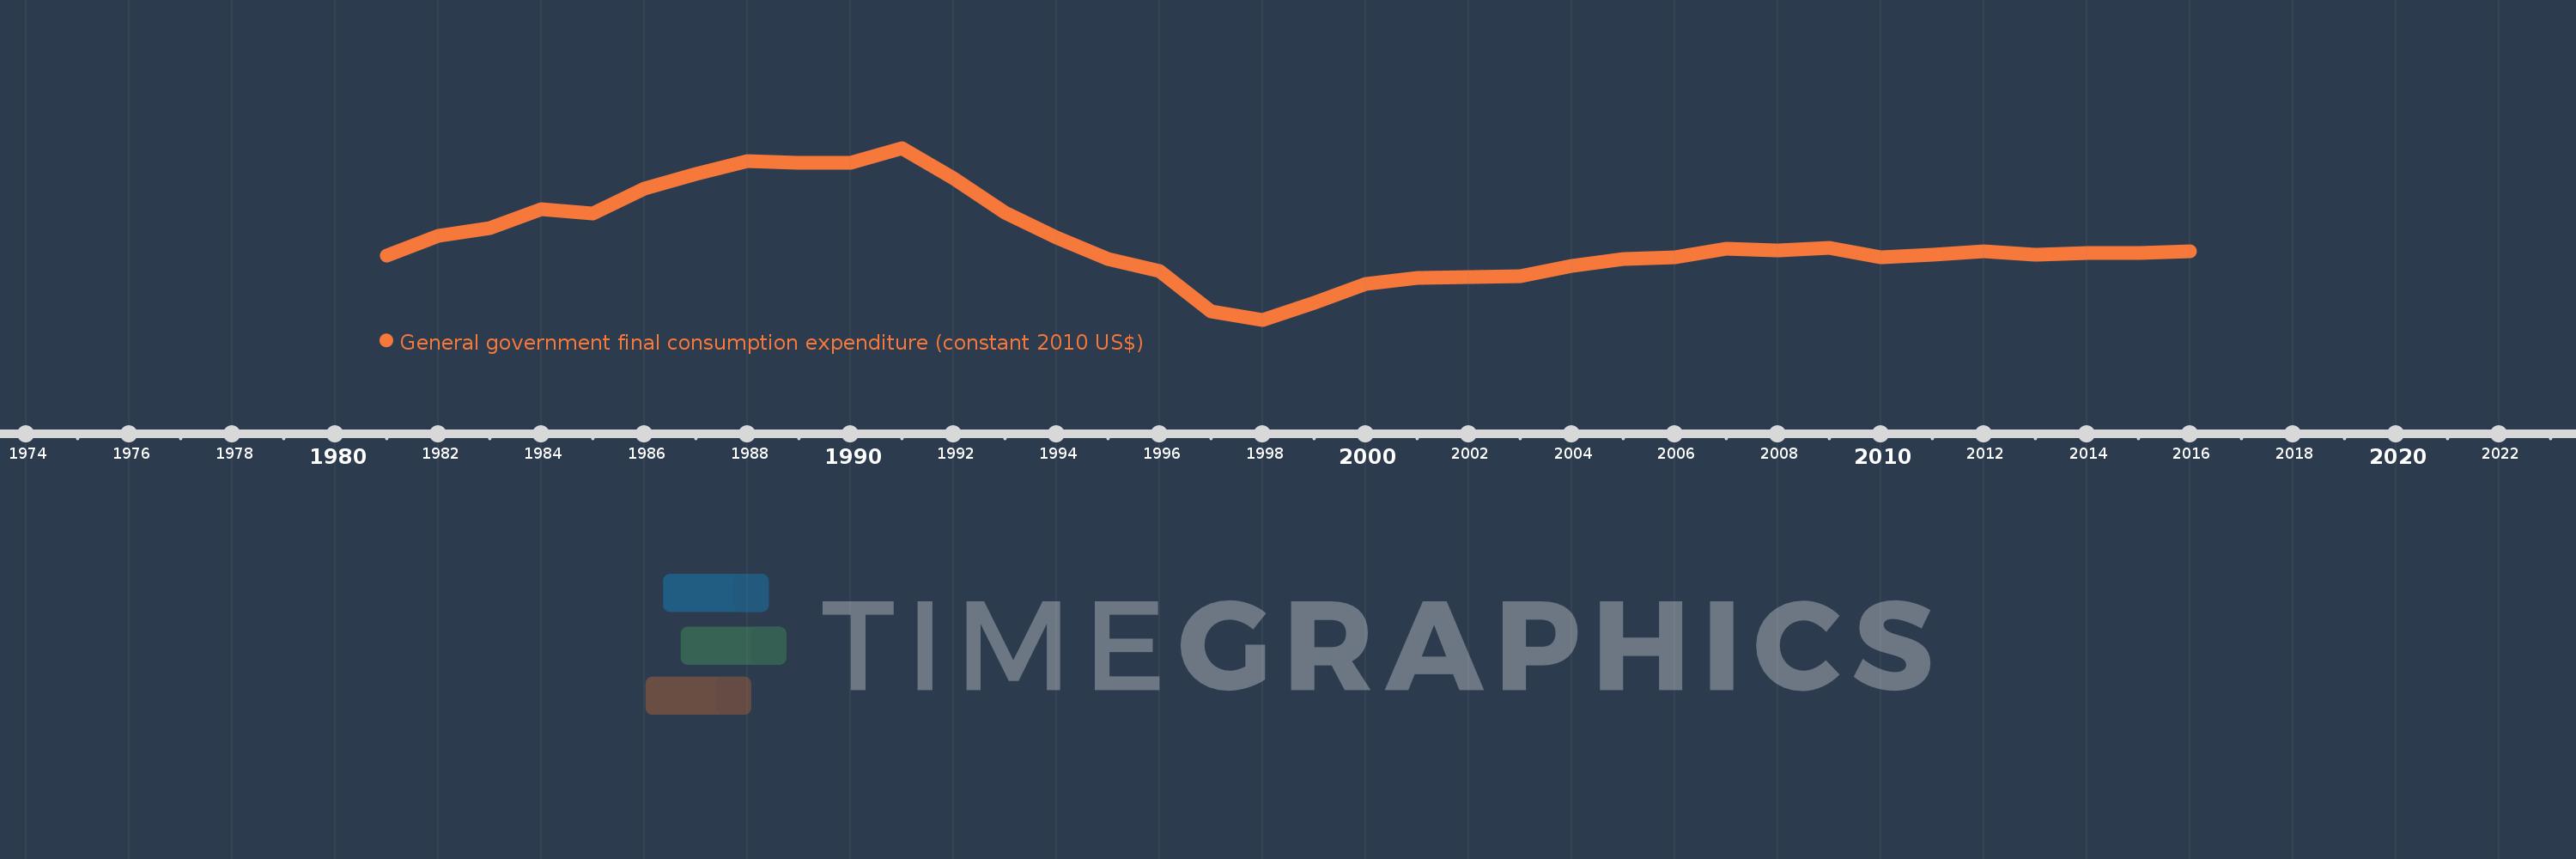
General government final consumption expenditure (constant 2010 US$)
2016,2015,2014,2013,2012,2011,2010,2009,2008,2007,2006,2005,2004,2003,2002,2001,2000,1999,1998,1997,1996,1995,1994,1993,1992,1991,1990,1989,1988,1987,1986,1985,1984,1983,1982,1981
This statistics in other country:
AfghanistanAlbaniaAlgeriaAngolaAntigua and BarbudaArab WorldArgentinaArmeniaArubaAustraliaAustriaAzerbaijanBahamas, TheBahrainBangladeshBarbadosBelarusBelgiumBelizeBeninBermudaBhutanBoliviaBosnia and HerzegovinaBotswanaBrazilBrunei DarussalamBulgariaBurkina FasoBurundiCabo VerdeCambodiaCameroonCanadaCaribbean small statesCentral African RepublicCentral Europe and the BalticsChadChileChinaColombiaComorosCongo, Dem. Rep.Congo, Rep.Costa RicaCote d'IvoireCroatiaCubaCyprusCzech RepublicDenmarkDominicaDominican RepublicEarly-demographic dividendEast Asia & PacificEast Asia & Pacific (excluding high income)East Asia & Pacific (IDA & IBRD countries)EcuadorEgypt, Arab Rep.El SalvadorEquatorial GuineaEritreaEstoniaEuro areaEurope & Central AsiaEurope & Central Asia (excluding high income)Europe & Central Asia (IDA & IBRD countries)European UnionFaroe IslandsFinlandFragile and conflict affected situationsFranceGabonGambia, TheGeorgiaGermanyGhanaGreeceGrenadaGuatemalaGuineaGuinea-BissauGuyanaHaitiHeavily indebted poor countries (HIPC)High incomeHondurasHong Kong SAR, ChinaHungaryIBRD onlyIcelandIDA & IBRD totalIDA blendIDA onlyIDA totalIndiaIndonesiaIran, Islamic Rep.IraqIrelandIsraelItalyJamaicaJapanJordanKazakhstanKenyaKorea, Rep.KosovoKuwaitKyrgyz RepublicLao PDRLate-demographic dividendLatin America & Caribbean Latin America & Caribbean (excluding high income)Latin America & the Caribbean (IDA & IBRD countries)LatviaLeast developed countries: UN classificationLebanonLiberiaLithuaniaLow & middle incomeLow incomeLower middle incomeLuxembourgMacao SAR, ChinaMacedonia, FYRMadagascarMalawiMalaysiaMaliMaltaMauritaniaMauritiusMexicoMiddle East & North AfricaMiddle East & North Africa (excluding high income)Middle East & North Africa (IDA & IBRD countries)Middle incomeMoldovaMongoliaMontenegroMoroccoMozambiqueNamibiaNepalNetherlandsNew ZealandNicaraguaNigerNigeriaNorth AmericaNorwayOECD membersOmanOther small statesPakistanPanamaParaguayPeruPhilippinesPolandPortugalPost-demographic dividendPre-demographic dividendPuerto RicoQatarRomaniaRussian FederationRwandaSaudi ArabiaSenegalSerbiaSeychellesSierra LeoneSingaporeSlovak RepublicSloveniaSmall statesSouth AfricaSouth AsiaSouth Asia (IDA & IBRD)South SudanSpainSri LankaSt. Kitts and NevisSt. LuciaSt. Vincent and the GrenadinesSub-Saharan Africa Sub-Saharan Africa (excluding high income)Sub-Saharan Africa (IDA & IBRD countries)SudanSurinameSwazilandSwedenSwitzerlandTajikistanTanzaniaThailandTimor-LesteTogoTongaTrinidad and TobagoTunisiaTurkeyTurkmenistanUgandaUkraineUnited Arab EmiratesUnited KingdomUnited StatesUpper middle incomeUruguayUzbekistanVanuatuVenezuela, RBVietnamWest Bank and GazaWorldYemen, Rep.ZambiaZimbabwe Timeline:
This timeline shows a graph from 1981 to 2016 of Bulgaria. No data until 1980. Number of actual observations by date: 36.
Source name:
World Development Indicators
Source organization:
World Bank national accounts data, and OECD National Accounts data files.
Categories, topics:
Economy & Growth
Last updated:
apr 23, 2017
Indicators value changes by year
Minimum:
4.89 bln
jan 1, 1998
Maximum:
13.976 bln
jan 1, 1991
At the date of observation
Value
Absolute change
Change from previous value
jan 1, 1981
8.286 bln
+8.286 bln
0.0%
jan 1, 1982
9.35 bln
+1.064 bln
12.84%
jan 1, 1983
9.747 bln
+397.292 mln
4.25%
jan 1, 1984
10.733 bln
+985.766 mln
10.11%
jan 1, 1985
10.508 bln
-225.641 mln
-2.1%
jan 1, 1986
11.82 bln
+1.312 bln
12.49%
jan 1, 1987
12.594 bln
+774.268 mln
6.55%
jan 1, 1988
13.298 bln
+703.359 mln
5.58%
jan 1, 1989
13.201 bln
-96.678 mln
-0.73%
jan 1, 1990
13.211 bln
+10.096 mln
0.08%
jan 1, 1991
13.976 bln
+765.238 mln
5.79%
jan 1, 1992
12.373 bln
-1.603 bln
-11.47%
jan 1, 1993
10.534 bln
-1.839 bln
-14.86%
jan 1, 1994
9.215 bln
-1.319 bln
-12.52%
jan 1, 1995
8.123 bln
-1.092 bln
-11.85%
jan 1, 1996
7.461 bln
-662.198 mln
-8.15%
jan 1, 1997
5.35 bln
-2.111 bln
-28.29%
jan 1, 1998
4.89 bln
-460.202 mln
-8.6%
jan 1, 1999
5.783 bln
+893.667 mln
18.28%
jan 1, 2000
6.784 bln
+1.0 bln
17.3%
jan 1, 2001
7.093 bln
+308.854 mln
4.55%
jan 1, 2002
7.161 bln
+67.822 mln
0.96%
jan 1, 2003
7.191 bln
+30.188 mln
0.42%
jan 1, 2004
7.758 bln
+567.756 mln
7.9%
jan 1, 2005
8.122 bln
+363.884 mln
4.69%
jan 1, 2006
8.178 bln
+55.435 mln
0.68%
jan 1, 2007
8.63 bln
+452.35 mln
5.53%
jan 1, 2008
8.535 bln
-94.829 mln
-1.1%
jan 1, 2009
8.69 bln
+154.596 mln
1.81%
jan 1, 2010
8.174 bln
-515.434 mln
-5.93%
jan 1, 2011
8.339 bln
+164.479 mln
2.01%
jan 1, 2012
8.52 bln
+181.468 mln
2.18%
jan 1, 2013
8.351 bln
-168.946 mln
-1.98%
jan 1, 2014
8.402 bln
+50.427 mln
0.6%
jan 1, 2015
8.414 bln
+11.777 mln
0.14%
jan 1, 2016
8.527 bln
+113.646 mln
1.35%
Ranking of countries by current statistics by years


Comments: