29
/
en
AIzaSyAYiBZKx7MnpbEhh9jyipgxe19OcubqV5w
April 1, 2024
128314
Eritrea
ERI
true
2
1
General government final consumption expenditure (constant 2010 US$)
2012,2011,2010,2009,2008,2007,2006,2005,2004,2003,2002,2001,2000,1999,1998,1997,1996,1995,1994,1993
This statistics in other country:
AfghanistanAlbaniaAlgeriaAngolaAntigua and BarbudaArab WorldArgentinaArmeniaArubaAustraliaAustriaAzerbaijanBahamas, TheBahrainBangladeshBarbadosBelarusBelgiumBelizeBeninBermudaBhutanBoliviaBosnia and HerzegovinaBotswanaBrazilBrunei DarussalamBulgariaBurkina FasoBurundiCabo VerdeCambodiaCameroonCanadaCaribbean small statesCentral African RepublicCentral Europe and the BalticsChadChileChinaColombiaComorosCongo, Dem. Rep.Congo, Rep.Costa RicaCote d'IvoireCroatiaCubaCyprusCzech RepublicDenmarkDominicaDominican RepublicEarly-demographic dividendEast Asia & PacificEast Asia & Pacific (excluding high income)East Asia & Pacific (IDA & IBRD countries)EcuadorEgypt, Arab Rep.El SalvadorEquatorial GuineaEritreaEstoniaEuro areaEurope & Central AsiaEurope & Central Asia (excluding high income)Europe & Central Asia (IDA & IBRD countries)European UnionFaroe IslandsFinlandFragile and conflict affected situationsFranceGabonGambia, TheGeorgiaGermanyGhanaGreeceGrenadaGuatemalaGuineaGuinea-BissauGuyanaHaitiHeavily indebted poor countries (HIPC)High incomeHondurasHong Kong SAR, ChinaHungaryIBRD onlyIcelandIDA & IBRD totalIDA blendIDA onlyIDA totalIndiaIndonesiaIran, Islamic Rep.IraqIrelandIsraelItalyJamaicaJapanJordanKazakhstanKenyaKorea, Rep.KosovoKuwaitKyrgyz RepublicLao PDRLate-demographic dividendLatin America & Caribbean Latin America & Caribbean (excluding high income)Latin America & the Caribbean (IDA & IBRD countries)LatviaLeast developed countries: UN classificationLebanonLiberiaLithuaniaLow & middle incomeLow incomeLower middle incomeLuxembourgMacao SAR, ChinaMacedonia, FYRMadagascarMalawiMalaysiaMaliMaltaMauritaniaMauritiusMexicoMiddle East & North AfricaMiddle East & North Africa (excluding high income)Middle East & North Africa (IDA & IBRD countries)Middle incomeMoldovaMongoliaMontenegroMoroccoMozambiqueNamibiaNepalNetherlandsNew ZealandNicaraguaNigerNigeriaNorth AmericaNorwayOECD membersOmanOther small statesPakistanPanamaParaguayPeruPhilippinesPolandPortugalPost-demographic dividendPre-demographic dividendPuerto RicoQatarRomaniaRussian FederationRwandaSaudi ArabiaSenegalSerbiaSeychellesSierra LeoneSingaporeSlovak RepublicSloveniaSmall statesSouth AfricaSouth AsiaSouth Asia (IDA & IBRD)South SudanSpainSri LankaSt. Kitts and NevisSt. LuciaSt. Vincent and the GrenadinesSub-Saharan Africa Sub-Saharan Africa (excluding high income)Sub-Saharan Africa (IDA & IBRD countries)SudanSurinameSwazilandSwedenSwitzerlandTajikistanTanzaniaThailandTimor-LesteTogoTongaTrinidad and TobagoTunisiaTurkeyTurkmenistanUgandaUkraineUnited Arab EmiratesUnited KingdomUnited StatesUpper middle incomeUruguayUzbekistanVanuatuVenezuela, RBVietnamWest Bank and GazaWorldYemen, Rep.ZambiaZimbabwe Timeline:
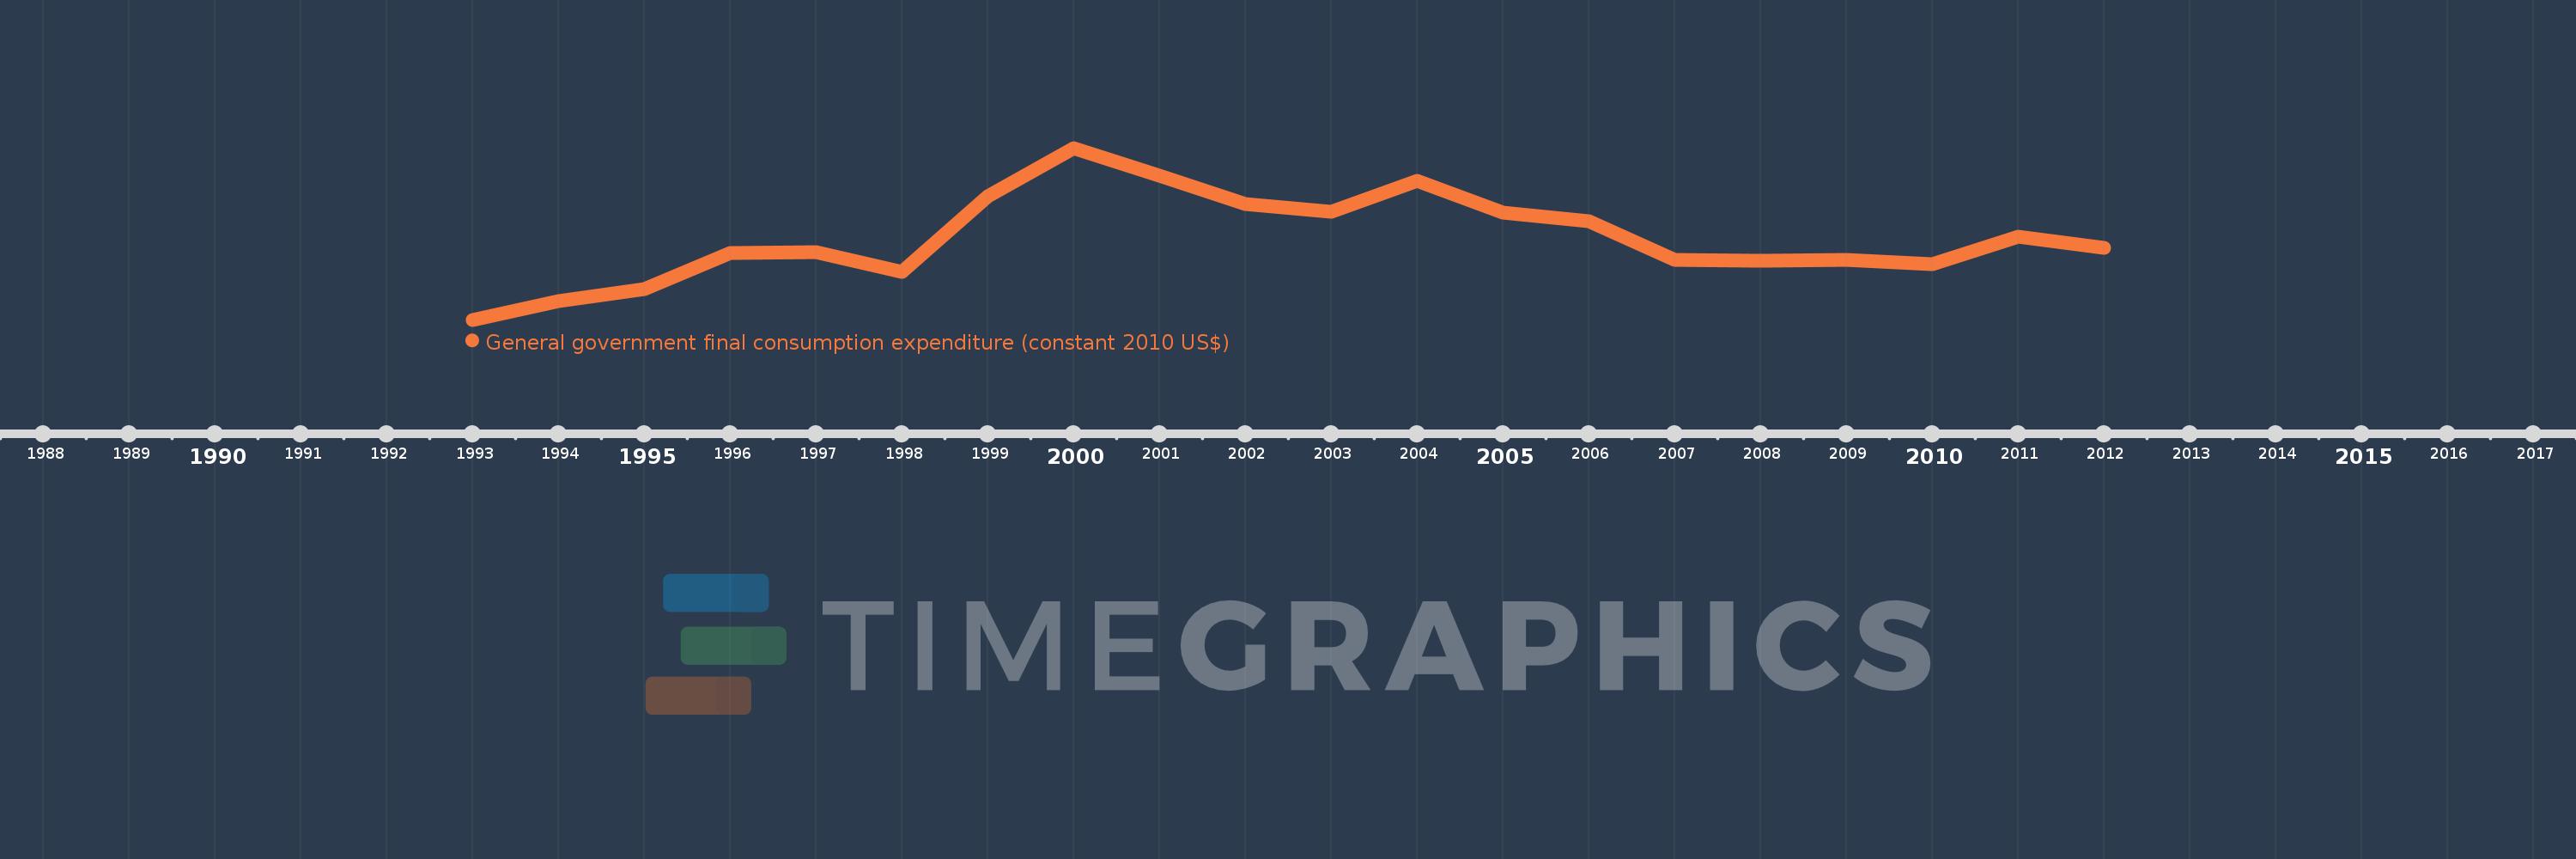
This timeline shows a graph from 1993 to 2012 of Eritrea. No data until 1992. Number of actual observations by date: 20.
Source name:
World Development Indicators
Source organization:
World Bank national accounts data, and OECD National Accounts data files.
Categories, topics:
Economy & Growth
Last updated:
apr 23, 2017
Indicators value changes by year
Minimum:
151.961 mln
jan 1, 1993
Maximum:
885.972 mln
jan 1, 2000
At the date of observation
Value
Absolute change
Change from previous value
jan 1, 1993
151.961 mln
+151.961 mln
0.0%
jan 1, 1994
230.815 mln
+78.854 mln
51.89%
jan 1, 1995
281.256 mln
+50.441 mln
21.85%
jan 1, 1996
438.74 mln
+157.484 mln
55.99%
jan 1, 1997
441.964 mln
+3.224 mln
0.73%
jan 1, 1998
356.502 mln
-85.462 mln
-19.34%
jan 1, 1999
679.292 mln
+322.79 mln
90.54%
jan 1, 2000
885.972 mln
+206.68 mln
30.43%
jan 1, 2001
767.718 mln
-118.254 mln
-13.35%
jan 1, 2002
646.386 mln
-121.332 mln
-15.8%
jan 1, 2003
613.378 mln
-33.008 mln
-5.11%
jan 1, 2004
743.86 mln
+130.482 mln
21.27%
jan 1, 2005
609.099 mln
-134.762 mln
-18.12%
jan 1, 2006
571.46 mln
-37.638 mln
-6.18%
jan 1, 2007
406.309 mln
-165.152 mln
-28.9%
jan 1, 2008
403.796 mln
-2.512 mln
-0.62%
jan 1, 2009
408.25 mln
+4.454 mln
1.1%
jan 1, 2010
388.538 mln
-19.712 mln
-4.83%
jan 1, 2011
505.566 mln
+117.027 mln
30.12%
jan 1, 2012
457.747 mln
-47.818 mln
-9.46%
Ranking of countries by current statistics by years


Comments: