29
/
en
AIzaSyAYiBZKx7MnpbEhh9jyipgxe19OcubqV5w
April 1, 2024
235782
Senegal
SEN
true
2
1
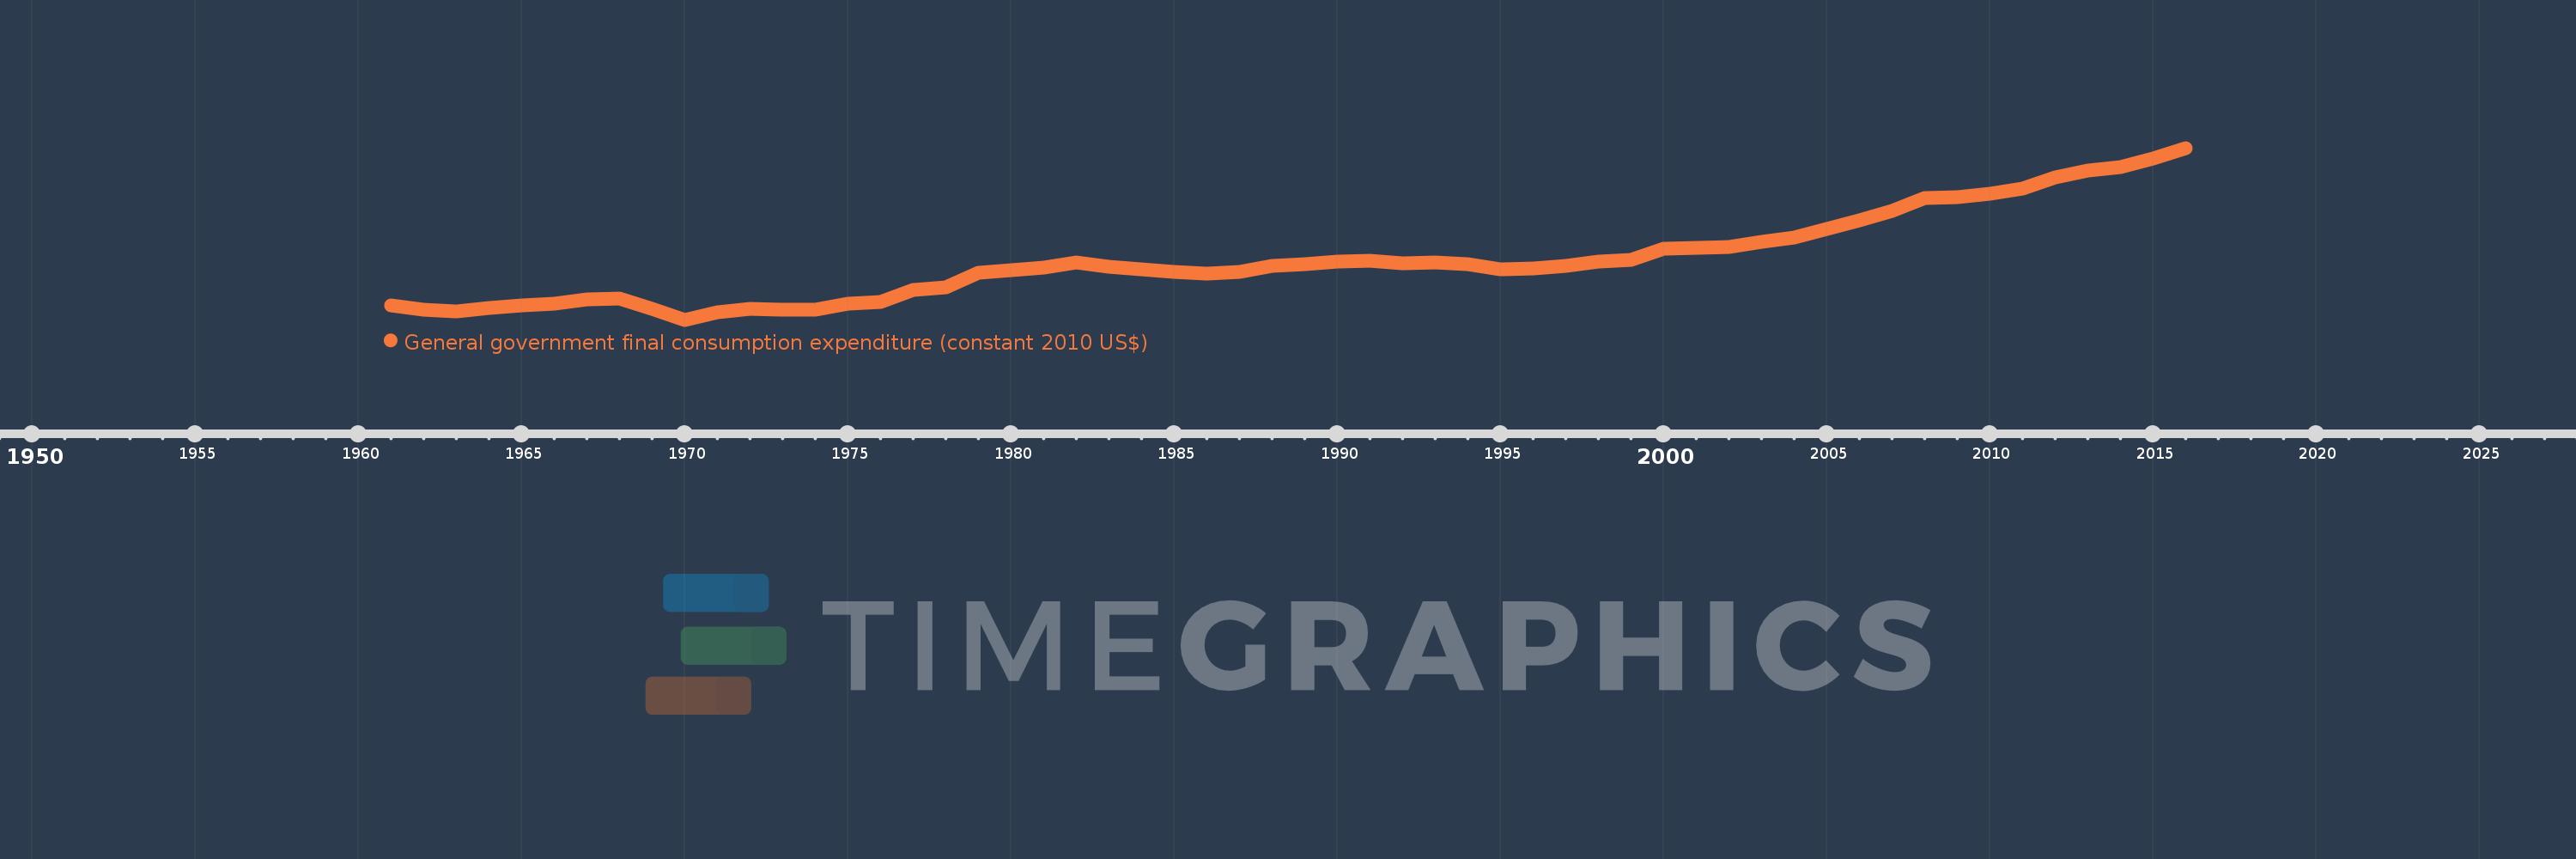
General government final consumption expenditure (constant 2010 US$)
2016,2015,2014,2013,2012,2011,2010,2009,2008,2007,2006,2005,2004,2003,2002,2001,2000,1999,1998,1997,1996,1995,1994,1993,1992,1991,1990,1989,1988,1987,1986,1985,1984,1983,1982,1981,1980,1979,1978,1977,1976,1975,1974,1973,1972,1971,1970,1969,1968,1967,1966,1965,1964,1963,1962,1961
This statistics in other country:
AfghanistanAlbaniaAlgeriaAngolaAntigua and BarbudaArab WorldArgentinaArmeniaArubaAustraliaAustriaAzerbaijanBahamas, TheBahrainBangladeshBarbadosBelarusBelgiumBelizeBeninBermudaBhutanBoliviaBosnia and HerzegovinaBotswanaBrazilBrunei DarussalamBulgariaBurkina FasoBurundiCabo VerdeCambodiaCameroonCanadaCaribbean small statesCentral African RepublicCentral Europe and the BalticsChadChileChinaColombiaComorosCongo, Dem. Rep.Congo, Rep.Costa RicaCote d'IvoireCroatiaCubaCyprusCzech RepublicDenmarkDominicaDominican RepublicEarly-demographic dividendEast Asia & PacificEast Asia & Pacific (excluding high income)East Asia & Pacific (IDA & IBRD countries)EcuadorEgypt, Arab Rep.El SalvadorEquatorial GuineaEritreaEstoniaEuro areaEurope & Central AsiaEurope & Central Asia (excluding high income)Europe & Central Asia (IDA & IBRD countries)European UnionFaroe IslandsFinlandFragile and conflict affected situationsFranceGabonGambia, TheGeorgiaGermanyGhanaGreeceGrenadaGuatemalaGuineaGuinea-BissauGuyanaHaitiHeavily indebted poor countries (HIPC)High incomeHondurasHong Kong SAR, ChinaHungaryIBRD onlyIcelandIDA & IBRD totalIDA blendIDA onlyIDA totalIndiaIndonesiaIran, Islamic Rep.IraqIrelandIsraelItalyJamaicaJapanJordanKazakhstanKenyaKorea, Rep.KosovoKuwaitKyrgyz RepublicLao PDRLate-demographic dividendLatin America & Caribbean Latin America & Caribbean (excluding high income)Latin America & the Caribbean (IDA & IBRD countries)LatviaLeast developed countries: UN classificationLebanonLiberiaLithuaniaLow & middle incomeLow incomeLower middle incomeLuxembourgMacao SAR, ChinaMacedonia, FYRMadagascarMalawiMalaysiaMaliMaltaMauritaniaMauritiusMexicoMiddle East & North AfricaMiddle East & North Africa (excluding high income)Middle East & North Africa (IDA & IBRD countries)Middle incomeMoldovaMongoliaMontenegroMoroccoMozambiqueNamibiaNepalNetherlandsNew ZealandNicaraguaNigerNigeriaNorth AmericaNorwayOECD membersOmanOther small statesPakistanPanamaParaguayPeruPhilippinesPolandPortugalPost-demographic dividendPre-demographic dividendPuerto RicoQatarRomaniaRussian FederationRwandaSaudi ArabiaSenegalSerbiaSeychellesSierra LeoneSingaporeSlovak RepublicSloveniaSmall statesSouth AfricaSouth AsiaSouth Asia (IDA & IBRD)South SudanSpainSri LankaSt. Kitts and NevisSt. LuciaSt. Vincent and the GrenadinesSub-Saharan Africa Sub-Saharan Africa (excluding high income)Sub-Saharan Africa (IDA & IBRD countries)SudanSurinameSwazilandSwedenSwitzerlandTajikistanTanzaniaThailandTimor-LesteTogoTongaTrinidad and TobagoTunisiaTurkeyTurkmenistanUgandaUkraineUnited Arab EmiratesUnited KingdomUnited StatesUpper middle incomeUruguayUzbekistanVanuatuVenezuela, RBVietnamWest Bank and GazaWorldYemen, Rep.ZambiaZimbabwe Timeline:
This timeline shows a graph from 1961 to 2016 of Senegal. No data until 1960. Number of actual observations by date: 56.
Source name:
World Development Indicators
Source organization:
World Bank national accounts data, and OECD National Accounts data files.
Categories, topics:
Economy & Growth
Last updated:
apr 23, 2017
Indicators value changes by year
Minimum:
680.193 mln
jan 1, 1970
Maximum:
2.292 bln
jan 1, 2016
At the date of observation
Value
Absolute change
Change from previous value
jan 1, 1961
817.935 mln
+817.935 mln
0.0%
jan 1, 1962
775.313 mln
-42.622 mln
-5.21%
jan 1, 1963
755.017 mln
-20.296 mln
-2.62%
jan 1, 1964
789.521 mln
+34.503 mln
4.57%
jan 1, 1965
815.905 mln
+26.385 mln
3.34%
jan 1, 1966
830.113 mln
+14.207 mln
1.74%
jan 1, 1967
871.063 mln
+40.95 mln
4.93%
jan 1, 1968
880.78 mln
+9.717 mln
1.12%
jan 1, 1969
783.61 mln
-97.17 mln
-11.03%
jan 1, 1970
680.193 mln
-103.417 mln
-13.2%
jan 1, 1971
749.6 mln
+69.407 mln
10.2%
jan 1, 1972
783.61 mln
+34.01 mln
4.54%
jan 1, 1973
773.893 mln
-9.717 mln
-1.24%
jan 1, 1974
771.116 mln
-2.776 mln
-0.36%
jan 1, 1975
830.113 mln
+58.996 mln
7.65%
jan 1, 1976
843.994 mln
+13.881 mln
1.67%
jan 1, 1977
956.434 mln
+112.44 mln
13.32%
jan 1, 1978
982.809 mln
+26.375 mln
2.76%
jan 1, 1979
1.121 bln
+138.121 mln
14.05%
jan 1, 1980
1.147 bln
+26.189 mln
2.34%
jan 1, 1981
1.171 bln
+23.977 mln
2.09%
jan 1, 1982
1.219 bln
+48.387 mln
4.13%
jan 1, 1983
1.18 bln
-39.525 mln
-3.24%
jan 1, 1984
1.15 bln
-29.891 mln
-2.53%
jan 1, 1985
1.127 bln
-22.64 mln
-1.97%
jan 1, 1986
1.11 bln
-17.876 mln
-1.59%
jan 1, 1987
1.133 bln
+23.114 mln
2.08%
jan 1, 1988
1.184 bln
+51.392 mln
4.54%
jan 1, 1989
1.204 bln
+20.309 mln
1.72%
jan 1, 1990
1.223 bln
+18.158 mln
1.51%
jan 1, 1991
1.231 bln
+8.505 mln
0.7%
jan 1, 1992
1.213 bln
-18.07 mln
-1.47%
jan 1, 1993
1.216 bln
+2.875 mln
0.24%
jan 1, 1994
1.2 bln
-16.291 mln
-1.34%
jan 1, 1995
1.155 bln
-44.1 mln
-3.68%
jan 1, 1996
1.165 bln
+9.254 mln
0.8%
jan 1, 1997
1.189 bln
+24.621 mln
2.11%
jan 1, 1998
1.229 bln
+39.795 mln
3.35%
jan 1, 1999
1.241 bln
+12.075 mln
0.98%
jan 1, 2000
1.349 bln
+108.278 mln
8.72%
jan 1, 2001
1.352 bln
+2.144 mln
0.16%
jan 1, 2002
1.366 bln
+14.632 mln
1.08%
jan 1, 2003
1.415 bln
+48.494 mln
3.55%
jan 1, 2004
1.453 bln
+38.169 mln
2.7%
jan 1, 2005
1.534 bln
+81.3 mln
5.6%
jan 1, 2006
1.616 bln
+82.023 mln
5.35%
jan 1, 2007
1.698 bln
+81.695 mln
5.05%
jan 1, 2008
1.821 bln
+123.255 mln
7.26%
jan 1, 2009
1.834 bln
+13.147 mln
0.72%
jan 1, 2010
1.865 bln
+30.93 mln
1.69%
jan 1, 2011
1.913 bln
+47.693 mln
2.56%
jan 1, 2012
2.019 bln
+106.157 mln
5.55%
jan 1, 2013
2.076 bln
+57.315 mln
2.84%
jan 1, 2014
2.11 bln
+33.086 mln
1.59%
jan 1, 2015
2.191 bln
+81.851 mln
3.88%
jan 1, 2016
2.292 bln
+100.819 mln
4.6%
Ranking of countries by current statistics by years


Comments: