29
/
en
AIzaSyAYiBZKx7MnpbEhh9jyipgxe19OcubqV5w
April 1, 2024
280985
Venezuela, RB
VEN
true
2
1
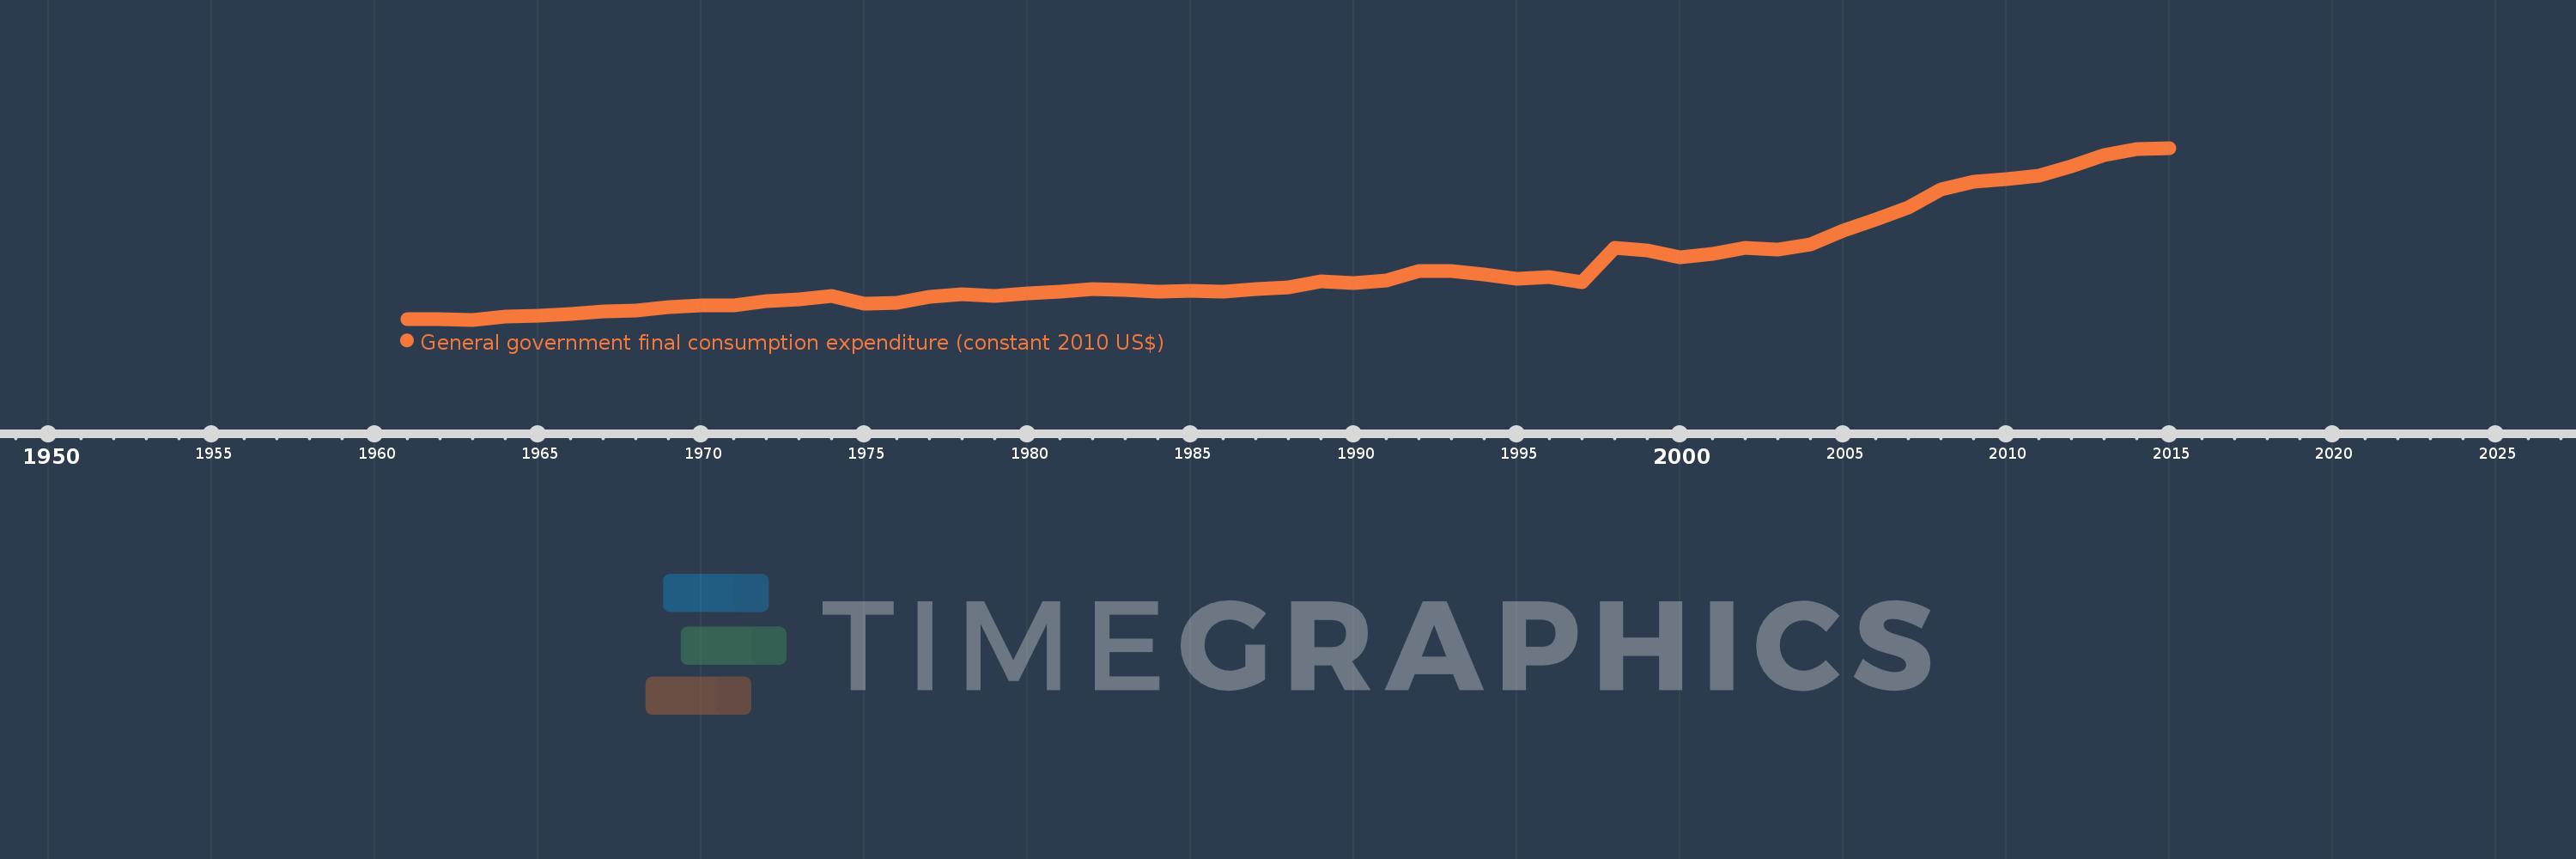
General government final consumption expenditure (constant 2010 US$)
2015,2014,2013,2012,2011,2010,2009,2008,2007,2006,2005,2004,2003,2002,2001,2000,1999,1998,1997,1996,1995,1994,1993,1992,1991,1990,1989,1988,1987,1986,1985,1984,1983,1982,1981,1980,1979,1978,1977,1976,1975,1974,1973,1972,1971,1970,1969,1968,1967,1966,1965,1964,1963,1962,1961
This statistics in other country:
AfghanistanAlbaniaAlgeriaAngolaAntigua and BarbudaArab WorldArgentinaArmeniaArubaAustraliaAustriaAzerbaijanBahamas, TheBahrainBangladeshBarbadosBelarusBelgiumBelizeBeninBermudaBhutanBoliviaBosnia and HerzegovinaBotswanaBrazilBrunei DarussalamBulgariaBurkina FasoBurundiCabo VerdeCambodiaCameroonCanadaCaribbean small statesCentral African RepublicCentral Europe and the BalticsChadChileChinaColombiaComorosCongo, Dem. Rep.Congo, Rep.Costa RicaCote d'IvoireCroatiaCubaCyprusCzech RepublicDenmarkDominicaDominican RepublicEarly-demographic dividendEast Asia & PacificEast Asia & Pacific (excluding high income)East Asia & Pacific (IDA & IBRD countries)EcuadorEgypt, Arab Rep.El SalvadorEquatorial GuineaEritreaEstoniaEuro areaEurope & Central AsiaEurope & Central Asia (excluding high income)Europe & Central Asia (IDA & IBRD countries)European UnionFaroe IslandsFinlandFragile and conflict affected situationsFranceGabonGambia, TheGeorgiaGermanyGhanaGreeceGrenadaGuatemalaGuineaGuinea-BissauGuyanaHaitiHeavily indebted poor countries (HIPC)High incomeHondurasHong Kong SAR, ChinaHungaryIBRD onlyIcelandIDA & IBRD totalIDA blendIDA onlyIDA totalIndiaIndonesiaIran, Islamic Rep.IraqIrelandIsraelItalyJamaicaJapanJordanKazakhstanKenyaKorea, Rep.KosovoKuwaitKyrgyz RepublicLao PDRLate-demographic dividendLatin America & Caribbean Latin America & Caribbean (excluding high income)Latin America & the Caribbean (IDA & IBRD countries)LatviaLeast developed countries: UN classificationLebanonLiberiaLithuaniaLow & middle incomeLow incomeLower middle incomeLuxembourgMacao SAR, ChinaMacedonia, FYRMadagascarMalawiMalaysiaMaliMaltaMauritaniaMauritiusMexicoMiddle East & North AfricaMiddle East & North Africa (excluding high income)Middle East & North Africa (IDA & IBRD countries)Middle incomeMoldovaMongoliaMontenegroMoroccoMozambiqueNamibiaNepalNetherlandsNew ZealandNicaraguaNigerNigeriaNorth AmericaNorwayOECD membersOmanOther small statesPakistanPanamaParaguayPeruPhilippinesPolandPortugalPost-demographic dividendPre-demographic dividendPuerto RicoQatarRomaniaRussian FederationRwandaSaudi ArabiaSenegalSerbiaSeychellesSierra LeoneSingaporeSlovak RepublicSloveniaSmall statesSouth AfricaSouth AsiaSouth Asia (IDA & IBRD)South SudanSpainSri LankaSt. Kitts and NevisSt. LuciaSt. Vincent and the GrenadinesSub-Saharan Africa Sub-Saharan Africa (excluding high income)Sub-Saharan Africa (IDA & IBRD countries)SudanSurinameSwazilandSwedenSwitzerlandTajikistanTanzaniaThailandTimor-LesteTogoTongaTrinidad and TobagoTunisiaTurkeyTurkmenistanUgandaUkraineUnited Arab EmiratesUnited KingdomUnited StatesUpper middle incomeUruguayUzbekistanVanuatuVenezuela, RBVietnamWest Bank and GazaWorldYemen, Rep.ZambiaZimbabwe Timeline:
This timeline shows a graph from 1961 to 2015 of Venezuela, RB. No data until 1960. Number of actual observations by date: 55.
Source name:
World Development Indicators
Source organization:
World Bank national accounts data, and OECD National Accounts data files.
Categories, topics:
Economy & Growth
Last updated:
apr 23, 2017
Indicators value changes by year
Minimum:
5.657 bln
jan 1, 1963
Maximum:
51.672 bln
jan 1, 2015
At the date of observation
Value
Absolute change
Change from previous value
jan 1, 1961
5.84 bln
+5.84 bln
0.0%
jan 1, 1962
5.78 bln
-60.385 mln
-1.03%
jan 1, 1963
5.657 bln
-122.658 mln
-2.12%
jan 1, 1964
6.569 bln
+911.444 mln
16.11%
jan 1, 1965
6.744 bln
+175.495 mln
2.67%
jan 1, 1966
7.258 bln
+513.277 mln
7.61%
jan 1, 1967
7.909 bln
+651.031 mln
8.97%
jan 1, 1968
8.209 bln
+300.04 mln
3.79%
jan 1, 1969
8.939 bln
+730.287 mln
8.9%
jan 1, 1970
9.492 bln
+553.355 mln
6.19%
jan 1, 1971
9.399 bln
-93.298 mln
-0.98%
jan 1, 1972
10.716 bln
+1.317 bln
14.02%
jan 1, 1973
11.148 bln
+431.102 mln
4.02%
jan 1, 1974
11.96 bln
+812.339 mln
7.29%
jan 1, 1975
9.931 bln
-2.028 bln
-16.96%
jan 1, 1976
10.239 bln
+307.475 mln
3.1%
jan 1, 1977
11.776 bln
+1.537 bln
15.02%
jan 1, 1978
12.453 bln
+676.443 mln
5.74%
jan 1, 1979
12.022 bln
-430.464 mln
-3.46%
jan 1, 1980
12.606 bln
+584.202 mln
4.86%
jan 1, 1981
13.068 bln
+461.211 mln
3.66%
jan 1, 1982
13.775 bln
+707.19 mln
5.41%
jan 1, 1983
13.652 bln
-122.989 mln
-0.89%
jan 1, 1984
13.283 bln
-368.969 mln
-2.7%
jan 1, 1985
13.317 bln
+34.13 mln
0.26%
jan 1, 1986
13.118 bln
-198.936 mln
-1.49%
jan 1, 1987
13.825 bln
+706.576 mln
5.39%
jan 1, 1988
14.291 bln
+466.746 mln
3.38%
jan 1, 1989
15.857 bln
+1.566 bln
10.96%
jan 1, 1990
15.498 bln
-359.437 mln
-2.27%
jan 1, 1991
16.275 bln
+777.295 mln
5.02%
jan 1, 1992
18.741 bln
+2.466 bln
15.15%
jan 1, 1993
18.698 bln
-43.661 mln
-0.23%
jan 1, 1994
17.722 bln
-975.616 mln
-5.22%
jan 1, 1995
16.68 bln
-1.043 bln
-5.88%
jan 1, 1996
17.108 bln
+428.619 mln
2.57%
jan 1, 1997
15.814 bln
-1.294 bln
-7.57%
jan 1, 1998
25.029 bln
+9.215 bln
58.27%
jan 1, 1999
24.263 bln
-765.504 mln
-3.06%
jan 1, 2000
22.444 bln
-1.819 bln
-7.5%
jan 1, 2001
23.383 bln
+939.268 mln
4.18%
jan 1, 2002
25.005 bln
+1.622 bln
6.93%
jan 1, 2003
24.383 bln
-621.942 mln
-2.49%
jan 1, 2004
25.774 bln
+1.391 bln
5.7%
jan 1, 2005
29.44 bln
+3.666 bln
14.22%
jan 1, 2006
32.576 bln
+3.136 bln
10.65%
jan 1, 2007
35.71 bln
+3.135 bln
9.62%
jan 1, 2008
40.621 bln
+4.91 bln
13.75%
jan 1, 2009
42.562 bln
+1.941 bln
4.78%
jan 1, 2010
43.217 bln
+655.077 mln
1.54%
jan 1, 2011
44.143 bln
+926.568 mln
2.14%
jan 1, 2012
46.757 bln
+2.613 bln
5.92%
jan 1, 2013
49.682 bln
+2.926 bln
6.26%
jan 1, 2014
51.343 bln
+1.661 bln
3.34%
jan 1, 2015
51.672 bln
+328.892 mln
0.64%
Ranking of countries by current statistics by years


Comments: