29
/
en
AIzaSyAYiBZKx7MnpbEhh9jyipgxe19OcubqV5w
April 1, 2024
255186
Swaziland
SWZ
true
2
1
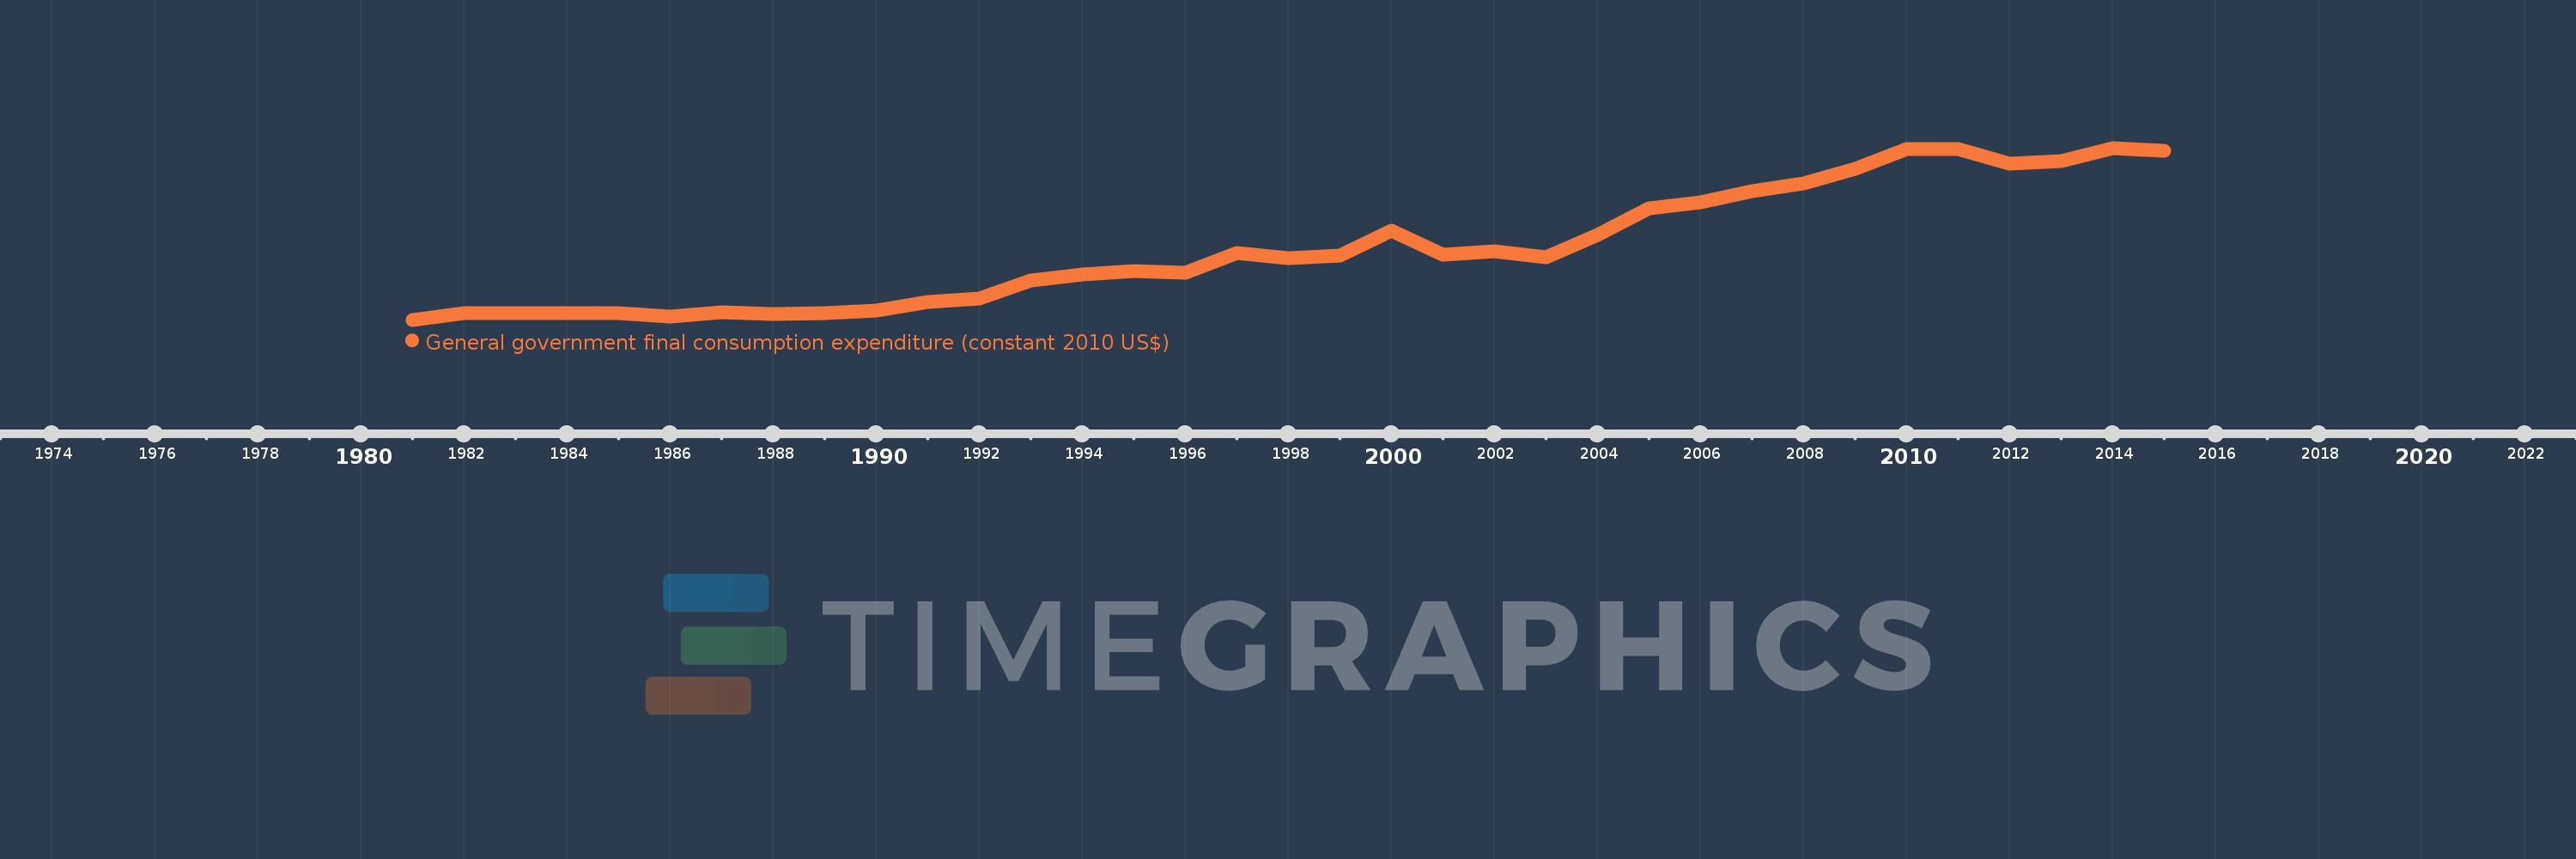
General government final consumption expenditure (constant 2010 US$)
2015,2014,2013,2012,2011,2010,2009,2008,2007,2006,2005,2004,2003,2002,2001,2000,1999,1998,1997,1996,1995,1994,1993,1992,1991,1990,1989,1988,1987,1986,1985,1984,1983,1982,1981
This statistics in other country:
AfghanistanAlbaniaAlgeriaAngolaAntigua and BarbudaArab WorldArgentinaArmeniaArubaAustraliaAustriaAzerbaijanBahamas, TheBahrainBangladeshBarbadosBelarusBelgiumBelizeBeninBermudaBhutanBoliviaBosnia and HerzegovinaBotswanaBrazilBrunei DarussalamBulgariaBurkina FasoBurundiCabo VerdeCambodiaCameroonCanadaCaribbean small statesCentral African RepublicCentral Europe and the BalticsChadChileChinaColombiaComorosCongo, Dem. Rep.Congo, Rep.Costa RicaCote d'IvoireCroatiaCubaCyprusCzech RepublicDenmarkDominicaDominican RepublicEarly-demographic dividendEast Asia & PacificEast Asia & Pacific (excluding high income)East Asia & Pacific (IDA & IBRD countries)EcuadorEgypt, Arab Rep.El SalvadorEquatorial GuineaEritreaEstoniaEuro areaEurope & Central AsiaEurope & Central Asia (excluding high income)Europe & Central Asia (IDA & IBRD countries)European UnionFaroe IslandsFinlandFragile and conflict affected situationsFranceGabonGambia, TheGeorgiaGermanyGhanaGreeceGrenadaGuatemalaGuineaGuinea-BissauGuyanaHaitiHeavily indebted poor countries (HIPC)High incomeHondurasHong Kong SAR, ChinaHungaryIBRD onlyIcelandIDA & IBRD totalIDA blendIDA onlyIDA totalIndiaIndonesiaIran, Islamic Rep.IraqIrelandIsraelItalyJamaicaJapanJordanKazakhstanKenyaKorea, Rep.KosovoKuwaitKyrgyz RepublicLao PDRLate-demographic dividendLatin America & Caribbean Latin America & Caribbean (excluding high income)Latin America & the Caribbean (IDA & IBRD countries)LatviaLeast developed countries: UN classificationLebanonLiberiaLithuaniaLow & middle incomeLow incomeLower middle incomeLuxembourgMacao SAR, ChinaMacedonia, FYRMadagascarMalawiMalaysiaMaliMaltaMauritaniaMauritiusMexicoMiddle East & North AfricaMiddle East & North Africa (excluding high income)Middle East & North Africa (IDA & IBRD countries)Middle incomeMoldovaMongoliaMontenegroMoroccoMozambiqueNamibiaNepalNetherlandsNew ZealandNicaraguaNigerNigeriaNorth AmericaNorwayOECD membersOmanOther small statesPakistanPanamaParaguayPeruPhilippinesPolandPortugalPost-demographic dividendPre-demographic dividendPuerto RicoQatarRomaniaRussian FederationRwandaSaudi ArabiaSenegalSerbiaSeychellesSierra LeoneSingaporeSlovak RepublicSloveniaSmall statesSouth AfricaSouth AsiaSouth Asia (IDA & IBRD)South SudanSpainSri LankaSt. Kitts and NevisSt. LuciaSt. Vincent and the GrenadinesSub-Saharan Africa Sub-Saharan Africa (excluding high income)Sub-Saharan Africa (IDA & IBRD countries)SudanSurinameSwazilandSwedenSwitzerlandTajikistanTanzaniaThailandTimor-LesteTogoTongaTrinidad and TobagoTunisiaTurkeyTurkmenistanUgandaUkraineUnited Arab EmiratesUnited KingdomUnited StatesUpper middle incomeUruguayUzbekistanVanuatuVenezuela, RBVietnamWest Bank and GazaWorldYemen, Rep.ZambiaZimbabwe Timeline:
This timeline shows a graph from 1981 to 2015 of Swaziland. No data until 1980. Number of actual observations by date: 35.
Source name:
World Development Indicators
Source organization:
World Bank national accounts data, and OECD National Accounts data files.
Categories, topics:
Economy & Growth
Last updated:
apr 23, 2017
Indicators value changes by year
Minimum:
152.119 mln
jan 1, 1981
Maximum:
853.831 mln
jan 1, 2014
At the date of observation
Value
Absolute change
Change from previous value
jan 1, 1981
152.119 mln
+152.119 mln
0.0%
jan 1, 1982
180.158 mln
+28.039 mln
18.43%
jan 1, 1983
180.439 mln
+280.838K
0.16%
jan 1, 1984
178.235 mln
-2.203 mln
-1.22%
jan 1, 1985
178.97 mln
+734.45K
0.41%
jan 1, 1986
163.503 mln
-15.467 mln
-8.64%
jan 1, 1987
183.506 mln
+20.003 mln
12.23%
jan 1, 1988
175.038 mln
-8.468 mln
-4.61%
jan 1, 1989
178.797 mln
+3.759 mln
2.15%
jan 1, 1990
188.539 mln
+9.742 mln
5.45%
jan 1, 1991
224.571 mln
+36.032 mln
19.11%
jan 1, 1992
238.629 mln
+14.058 mln
6.26%
jan 1, 1993
311.34 mln
+72.712 mln
30.47%
jan 1, 1994
337.559 mln
+26.219 mln
8.42%
jan 1, 1995
350.183 mln
+12.624 mln
3.74%
jan 1, 1996
345.306 mln
-4.877 mln
-1.39%
jan 1, 1997
423.168 mln
+77.862 mln
22.55%
jan 1, 1998
403.753 mln
-19.415 mln
-4.59%
jan 1, 1999
413.984 mln
+10.231 mln
2.53%
jan 1, 2000
514.888 mln
+100.904 mln
24.37%
jan 1, 2001
416.738 mln
-98.151 mln
-19.06%
jan 1, 2002
431.37 mln
+14.633 mln
3.51%
jan 1, 2003
406.233 mln
-25.138 mln
-5.83%
jan 1, 2004
499.625 mln
+93.392 mln
22.99%
jan 1, 2005
608.755 mln
+109.13 mln
21.84%
jan 1, 2006
631.843 mln
+23.089 mln
3.79%
jan 1, 2007
677.55 mln
+45.707 mln
7.23%
jan 1, 2008
709.128 mln
+31.578 mln
4.66%
jan 1, 2009
767.594 mln
+58.466 mln
8.24%
jan 1, 2010
850.328 mln
+82.734 mln
10.78%
jan 1, 2011
848.724 mln
-1.604 mln
-0.19%
jan 1, 2012
787.884 mln
-60.84 mln
-7.17%
jan 1, 2013
798.554 mln
+10.67 mln
1.35%
jan 1, 2014
853.831 mln
+55.277 mln
6.92%
jan 1, 2015
843.896 mln
-9.934 mln
-1.16%
Ranking of countries by current statistics by years


Comments: