29
/
en
AIzaSyAYiBZKx7MnpbEhh9jyipgxe19OcubqV5w
April 1, 2024
39923
IDA total
IDA
false
2
1
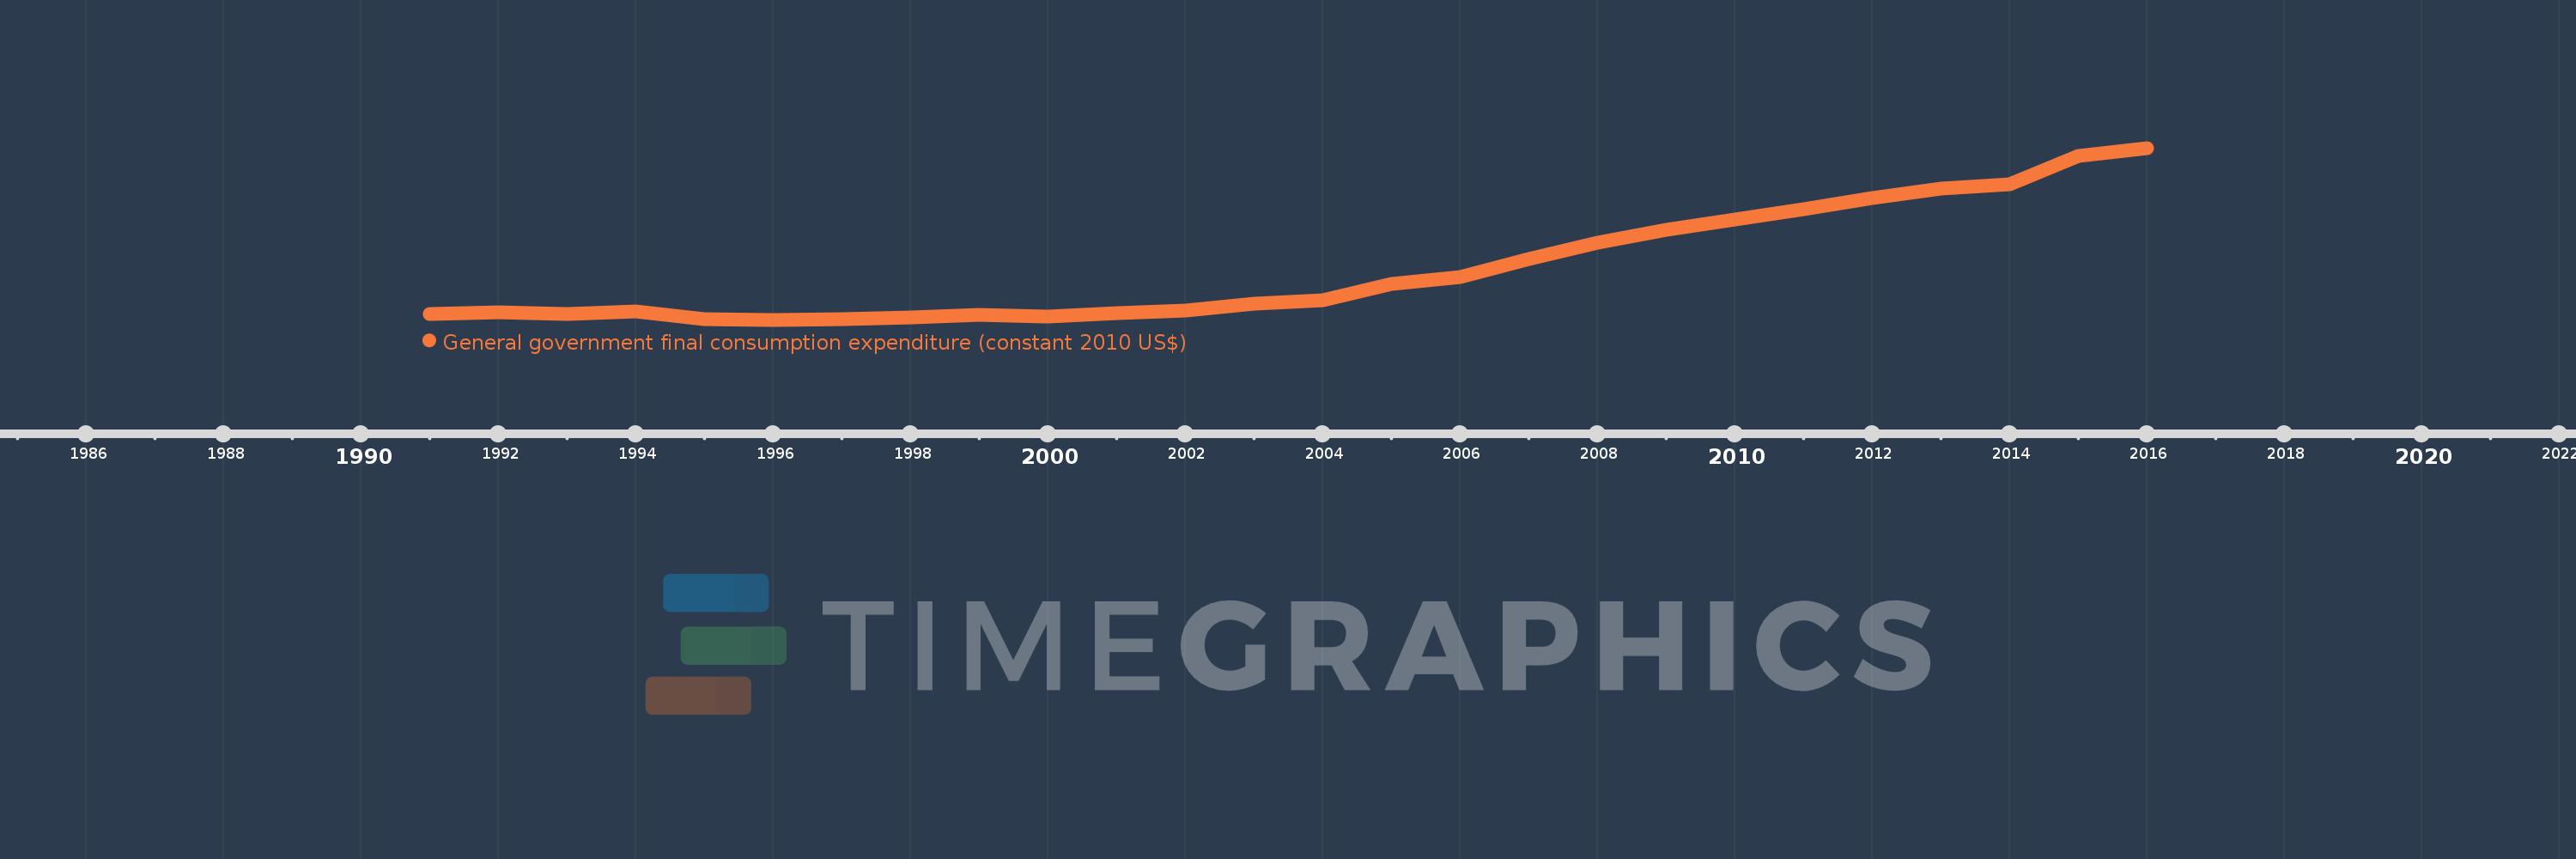
General government final consumption expenditure (constant 2010 US$)
2016,2015,2014,2013,2012,2011,2010,2009,2008,2007,2006,2005,2004,2003,2002,2001,2000,1999,1998,1997,1996,1995,1994,1993,1992,1991
This statistics in other country:
AfghanistanAlbaniaAlgeriaAngolaAntigua and BarbudaArab WorldArgentinaArmeniaArubaAustraliaAustriaAzerbaijanBahamas, TheBahrainBangladeshBarbadosBelarusBelgiumBelizeBeninBermudaBhutanBoliviaBosnia and HerzegovinaBotswanaBrazilBrunei DarussalamBulgariaBurkina FasoBurundiCabo VerdeCambodiaCameroonCanadaCaribbean small statesCentral African RepublicCentral Europe and the BalticsChadChileChinaColombiaComorosCongo, Dem. Rep.Congo, Rep.Costa RicaCote d'IvoireCroatiaCubaCyprusCzech RepublicDenmarkDominicaDominican RepublicEarly-demographic dividendEast Asia & PacificEast Asia & Pacific (excluding high income)East Asia & Pacific (IDA & IBRD countries)EcuadorEgypt, Arab Rep.El SalvadorEquatorial GuineaEritreaEstoniaEuro areaEurope & Central AsiaEurope & Central Asia (excluding high income)Europe & Central Asia (IDA & IBRD countries)European UnionFaroe IslandsFinlandFragile and conflict affected situationsFranceGabonGambia, TheGeorgiaGermanyGhanaGreeceGrenadaGuatemalaGuineaGuinea-BissauGuyanaHaitiHeavily indebted poor countries (HIPC)High incomeHondurasHong Kong SAR, ChinaHungaryIBRD onlyIcelandIDA & IBRD totalIDA blendIDA onlyIDA totalIndiaIndonesiaIran, Islamic Rep.IraqIrelandIsraelItalyJamaicaJapanJordanKazakhstanKenyaKorea, Rep.KosovoKuwaitKyrgyz RepublicLao PDRLate-demographic dividendLatin America & Caribbean Latin America & Caribbean (excluding high income)Latin America & the Caribbean (IDA & IBRD countries)LatviaLeast developed countries: UN classificationLebanonLiberiaLithuaniaLow & middle incomeLow incomeLower middle incomeLuxembourgMacao SAR, ChinaMacedonia, FYRMadagascarMalawiMalaysiaMaliMaltaMauritaniaMauritiusMexicoMiddle East & North AfricaMiddle East & North Africa (excluding high income)Middle East & North Africa (IDA & IBRD countries)Middle incomeMoldovaMongoliaMontenegroMoroccoMozambiqueNamibiaNepalNetherlandsNew ZealandNicaraguaNigerNigeriaNorth AmericaNorwayOECD membersOmanOther small statesPakistanPanamaParaguayPeruPhilippinesPolandPortugalPost-demographic dividendPre-demographic dividendPuerto RicoQatarRomaniaRussian FederationRwandaSaudi ArabiaSenegalSerbiaSeychellesSierra LeoneSingaporeSlovak RepublicSloveniaSmall statesSouth AfricaSouth AsiaSouth Asia (IDA & IBRD)South SudanSpainSri LankaSt. Kitts and NevisSt. LuciaSt. Vincent and the GrenadinesSub-Saharan Africa Sub-Saharan Africa (excluding high income)Sub-Saharan Africa (IDA & IBRD countries)SudanSurinameSwazilandSwedenSwitzerlandTajikistanTanzaniaThailandTimor-LesteTogoTongaTrinidad and TobagoTunisiaTurkeyTurkmenistanUgandaUkraineUnited Arab EmiratesUnited KingdomUnited StatesUpper middle incomeUruguayUzbekistanVanuatuVenezuela, RBVietnamWest Bank and GazaWorldYemen, Rep.ZambiaZimbabwe Timeline:
This timeline shows a graph from 1991 to 2016 of IDA total. No data until 1990. Number of actual observations by date: 26.
Source name:
World Development Indicators
Source organization:
World Bank national accounts data, and OECD National Accounts data files.
Categories, topics:
Economy & Growth
Last updated:
apr 23, 2017
Indicators value changes by year
Minimum:
64.634 bln
jan 1, 1996
Maximum:
228.017 bln
jan 1, 2016
At the date of observation
Value
Absolute change
Change from previous value
jan 1, 1991
69.752 bln
+69.752 bln
0.0%
jan 1, 1992
71.401 bln
+1.649 bln
2.36%
jan 1, 1993
69.896 bln
-1.506 bln
-2.11%
jan 1, 1994
72.485 bln
+2.589 bln
3.7%
jan 1, 1995
65.132 bln
-7.352 bln
-10.14%
jan 1, 1996
64.634 bln
-498.249 mln
-0.76%
jan 1, 1997
64.849 bln
+214.868 mln
0.33%
jan 1, 1998
66.621 bln
+1.773 bln
2.73%
jan 1, 1999
69.282 bln
+2.661 bln
3.99%
jan 1, 2000
67.315 bln
-1.967 bln
-2.84%
jan 1, 2001
71.109 bln
+3.795 bln
5.64%
jan 1, 2002
73.039 bln
+1.929 bln
2.71%
jan 1, 2003
79.763 bln
+6.724 bln
9.21%
jan 1, 2004
83.506 bln
+3.743 bln
4.69%
jan 1, 2005
98.803 bln
+15.297 bln
18.32%
jan 1, 2006
105.242 bln
+6.44 bln
6.52%
jan 1, 2007
122.254 bln
+17.011 bln
16.16%
jan 1, 2008
138.21 bln
+15.956 bln
13.05%
jan 1, 2009
150.197 bln
+11.987 bln
8.67%
jan 1, 2010
159.733 bln
+9.536 bln
6.35%
jan 1, 2011
170.115 bln
+10.382 bln
6.5%
jan 1, 2012
180.471 bln
+10.356 bln
6.09%
jan 1, 2013
189.371 bln
+8.9 bln
4.93%
jan 1, 2014
193.525 bln
+4.154 bln
2.19%
jan 1, 2015
220.588 bln
+27.062 bln
13.98%
jan 1, 2016
228.017 bln
+7.429 bln
3.37%
Ranking of countries by current statistics by years


Comments: