29
/
en
AIzaSyAYiBZKx7MnpbEhh9jyipgxe19OcubqV5w
April 1, 2024
275701
United Kingdom
GBR
true
2
1
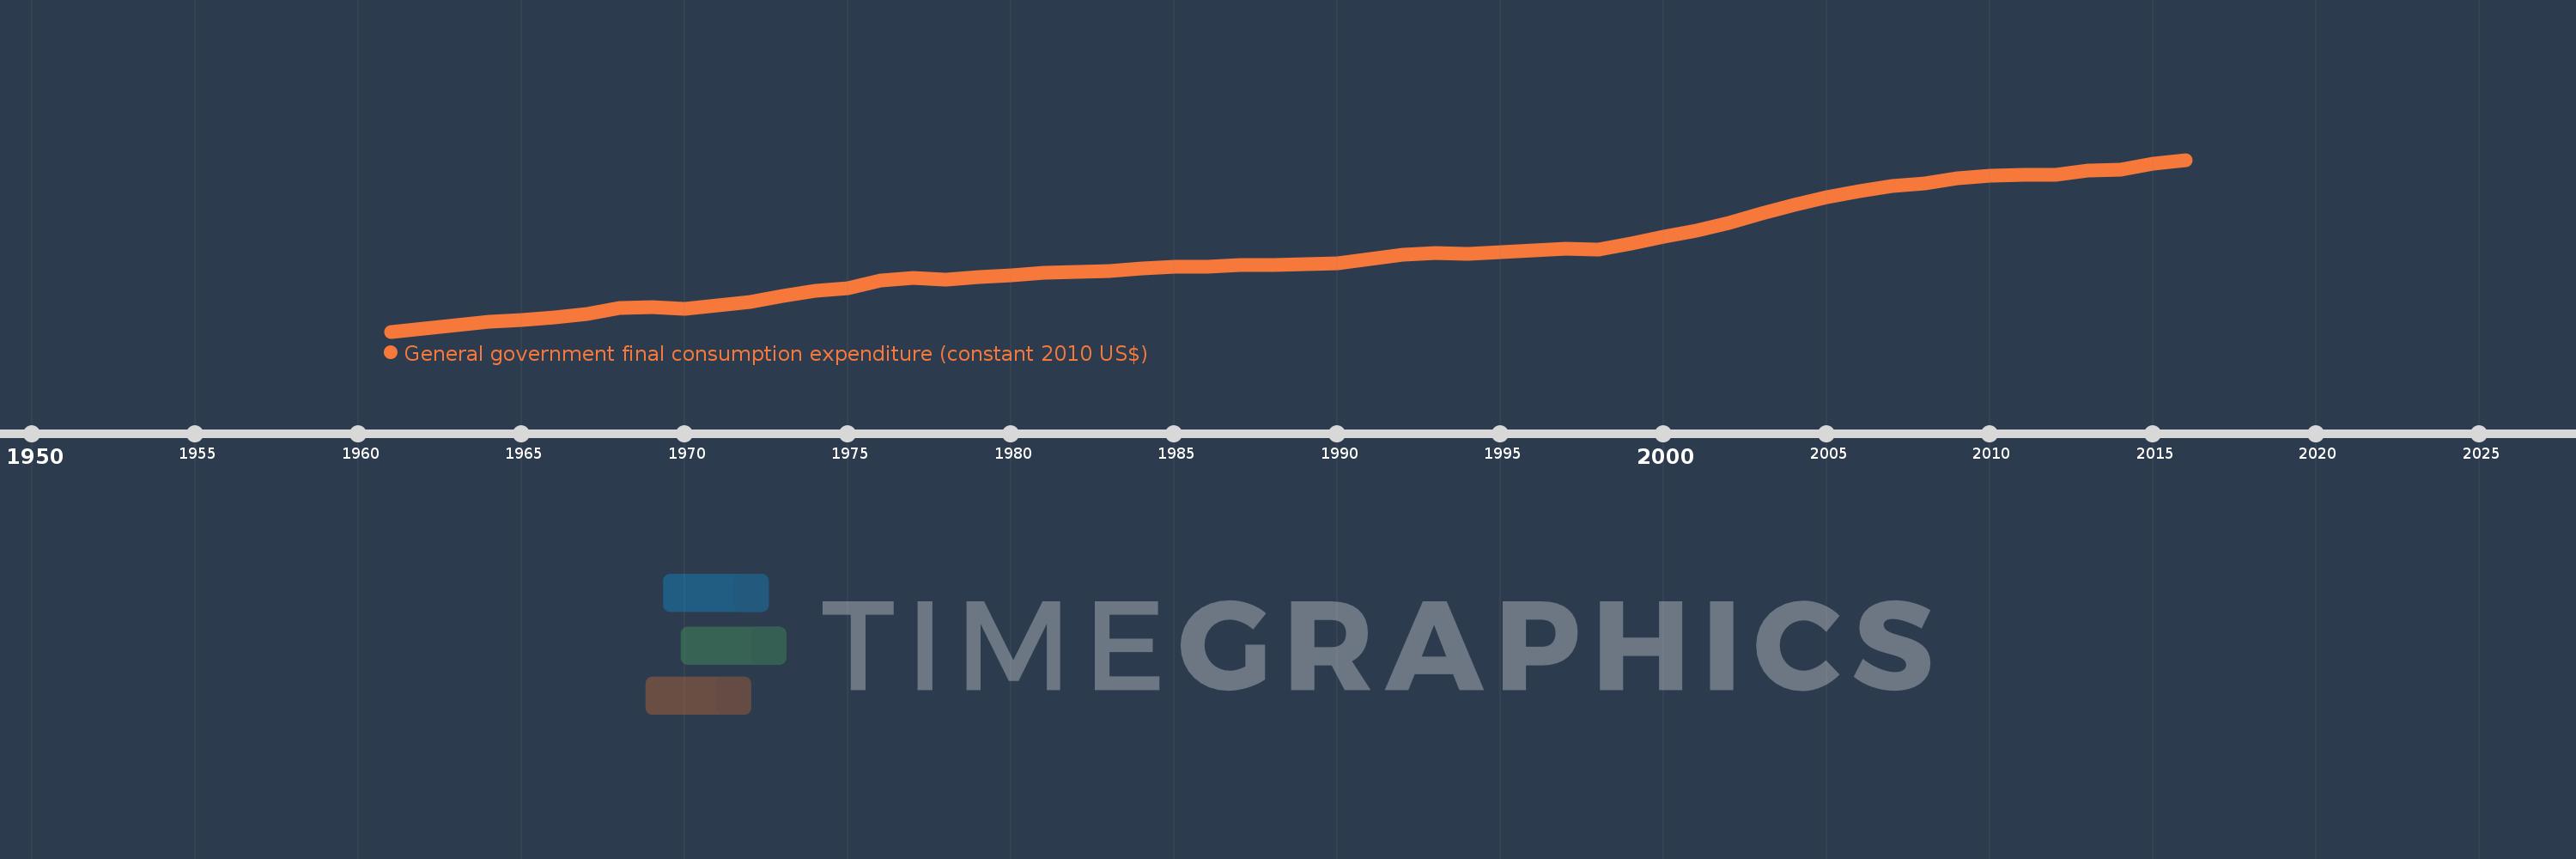
General government final consumption expenditure (constant 2010 US$)
2016,2015,2014,2013,2012,2011,2010,2009,2008,2007,2006,2005,2004,2003,2002,2001,2000,1999,1998,1997,1996,1995,1994,1993,1992,1991,1990,1989,1988,1987,1986,1985,1984,1983,1982,1981,1980,1979,1978,1977,1976,1975,1974,1973,1972,1971,1970,1969,1968,1967,1966,1965,1964,1963,1962,1961
This statistics in other country:
AfghanistanAlbaniaAlgeriaAngolaAntigua and BarbudaArab WorldArgentinaArmeniaArubaAustraliaAustriaAzerbaijanBahamas, TheBahrainBangladeshBarbadosBelarusBelgiumBelizeBeninBermudaBhutanBoliviaBosnia and HerzegovinaBotswanaBrazilBrunei DarussalamBulgariaBurkina FasoBurundiCabo VerdeCambodiaCameroonCanadaCaribbean small statesCentral African RepublicCentral Europe and the BalticsChadChileChinaColombiaComorosCongo, Dem. Rep.Congo, Rep.Costa RicaCote d'IvoireCroatiaCubaCyprusCzech RepublicDenmarkDominicaDominican RepublicEarly-demographic dividendEast Asia & PacificEast Asia & Pacific (excluding high income)East Asia & Pacific (IDA & IBRD countries)EcuadorEgypt, Arab Rep.El SalvadorEquatorial GuineaEritreaEstoniaEuro areaEurope & Central AsiaEurope & Central Asia (excluding high income)Europe & Central Asia (IDA & IBRD countries)European UnionFaroe IslandsFinlandFragile and conflict affected situationsFranceGabonGambia, TheGeorgiaGermanyGhanaGreeceGrenadaGuatemalaGuineaGuinea-BissauGuyanaHaitiHeavily indebted poor countries (HIPC)High incomeHondurasHong Kong SAR, ChinaHungaryIBRD onlyIcelandIDA & IBRD totalIDA blendIDA onlyIDA totalIndiaIndonesiaIran, Islamic Rep.IraqIrelandIsraelItalyJamaicaJapanJordanKazakhstanKenyaKorea, Rep.KosovoKuwaitKyrgyz RepublicLao PDRLate-demographic dividendLatin America & Caribbean Latin America & Caribbean (excluding high income)Latin America & the Caribbean (IDA & IBRD countries)LatviaLeast developed countries: UN classificationLebanonLiberiaLithuaniaLow & middle incomeLow incomeLower middle incomeLuxembourgMacao SAR, ChinaMacedonia, FYRMadagascarMalawiMalaysiaMaliMaltaMauritaniaMauritiusMexicoMiddle East & North AfricaMiddle East & North Africa (excluding high income)Middle East & North Africa (IDA & IBRD countries)Middle incomeMoldovaMongoliaMontenegroMoroccoMozambiqueNamibiaNepalNetherlandsNew ZealandNicaraguaNigerNigeriaNorth AmericaNorwayOECD membersOmanOther small statesPakistanPanamaParaguayPeruPhilippinesPolandPortugalPost-demographic dividendPre-demographic dividendPuerto RicoQatarRomaniaRussian FederationRwandaSaudi ArabiaSenegalSerbiaSeychellesSierra LeoneSingaporeSlovak RepublicSloveniaSmall statesSouth AfricaSouth AsiaSouth Asia (IDA & IBRD)South SudanSpainSri LankaSt. Kitts and NevisSt. LuciaSt. Vincent and the GrenadinesSub-Saharan Africa Sub-Saharan Africa (excluding high income)Sub-Saharan Africa (IDA & IBRD countries)SudanSurinameSwazilandSwedenSwitzerlandTajikistanTanzaniaThailandTimor-LesteTogoTongaTrinidad and TobagoTunisiaTurkeyTurkmenistanUgandaUkraineUnited Arab EmiratesUnited KingdomUnited StatesUpper middle incomeUruguayUzbekistanVanuatuVenezuela, RBVietnamWest Bank and GazaWorldYemen, Rep.ZambiaZimbabwe Timeline:
This timeline shows a graph from 1961 to 2016 of United Kingdom. No data until 1960. Number of actual observations by date: 56.
Source name:
World Development Indicators
Source organization:
World Bank national accounts data, and OECD National Accounts data files.
Categories, topics:
Economy & Growth
Last updated:
apr 23, 2017
Indicators value changes by year
Minimum:
197.689 bln
jan 1, 1961
Maximum:
554.753 bln
jan 1, 2016
At the date of observation
Value
Absolute change
Change from previous value
jan 1, 1961
197.689 bln
+197.689 bln
0.0%
jan 1, 1962
204.669 bln
+6.979 bln
3.53%
jan 1, 1963
210.937 bln
+6.268 bln
3.06%
jan 1, 1964
217.634 bln
+6.697 bln
3.18%
jan 1, 1965
221.461 bln
+3.827 bln
1.76%
jan 1, 1966
227.86 bln
+6.4 bln
2.89%
jan 1, 1967
234.416 bln
+6.556 bln
2.88%
jan 1, 1968
247.598 bln
+13.182 bln
5.62%
jan 1, 1969
248.836 bln
+1.238 bln
0.5%
jan 1, 1970
244.52 bln
-4.316 bln
-1.73%
jan 1, 1971
252.06 bln
+7.539 bln
3.08%
jan 1, 1972
259.906 bln
+7.846 bln
3.11%
jan 1, 1973
271.763 bln
+11.857 bln
4.56%
jan 1, 1974
281.825 bln
+10.062 bln
3.7%
jan 1, 1975
287.46 bln
+5.635 bln
2.0%
jan 1, 1976
303.843 bln
+16.383 bln
5.7%
jan 1, 1977
309.313 bln
+5.471 bln
1.8%
jan 1, 1978
304.983 bln
-4.33 bln
-1.4%
jan 1, 1979
310.472 bln
+5.489 bln
1.8%
jan 1, 1980
315.493 bln
+5.021 bln
1.62%
jan 1, 1981
320.411 bln
+4.918 bln
1.56%
jan 1, 1982
321.125 bln
+714.206 mln
0.22%
jan 1, 1983
323.451 bln
+2.326 bln
0.72%
jan 1, 1984
329.135 bln
+5.684 bln
1.76%
jan 1, 1985
333.187 bln
+4.052 bln
1.23%
jan 1, 1986
332.093 bln
-1.094 bln
-0.33%
jan 1, 1987
336.902 bln
+4.809 bln
1.45%
jan 1, 1988
336.615 bln
-286.057 mln
-0.08%
jan 1, 1989
337.141 bln
+525.372 mln
0.16%
jan 1, 1990
340.372 bln
+3.231 bln
0.96%
jan 1, 1991
347.833 bln
+7.462 bln
2.19%
jan 1, 1992
358.306 bln
+10.473 bln
3.01%
jan 1, 1993
360.954 bln
+2.648 bln
0.74%
jan 1, 1994
358.486 bln
-2.468 bln
-0.68%
jan 1, 1995
362.262 bln
+3.776 bln
1.05%
jan 1, 1996
366.99 bln
+4.728 bln
1.31%
jan 1, 1997
369.474 bln
+2.483 bln
0.68%
jan 1, 1998
368.236 bln
-1.238 bln
-0.34%
jan 1, 1999
380.594 bln
+12.358 bln
3.36%
jan 1, 2000
394.125 bln
+13.53 bln
3.56%
jan 1, 2001
407.429 bln
+13.304 bln
3.38%
jan 1, 2002
424.239 bln
+16.81 bln
4.13%
jan 1, 2003
442.609 bln
+18.37 bln
4.33%
jan 1, 2004
461.442 bln
+18.833 bln
4.26%
jan 1, 2005
477.656 bln
+16.214 bln
3.51%
jan 1, 2006
489.073 bln
+11.417 bln
2.39%
jan 1, 2007
499.783 bln
+10.709 bln
2.19%
jan 1, 2008
505.553 bln
+5.77 bln
1.15%
jan 1, 2009
516.012 bln
+10.459 bln
2.07%
jan 1, 2010
521.896 bln
+5.883 bln
1.14%
jan 1, 2011
522.849 bln
+953.583 mln
0.18%
jan 1, 2012
523.898 bln
+1.048 bln
0.2%
jan 1, 2013
532.68 bln
+8.782 bln
1.68%
jan 1, 2014
534.274 bln
+1.594 bln
0.3%
jan 1, 2015
546.461 bln
+12.187 bln
2.28%
jan 1, 2016
554.753 bln
+8.292 bln
1.52%
Ranking of countries by current statistics by years


Comments: