29
/
en
AIzaSyAYiBZKx7MnpbEhh9jyipgxe19OcubqV5w
April 1, 2024
262255
Thailand
THA
true
2
1
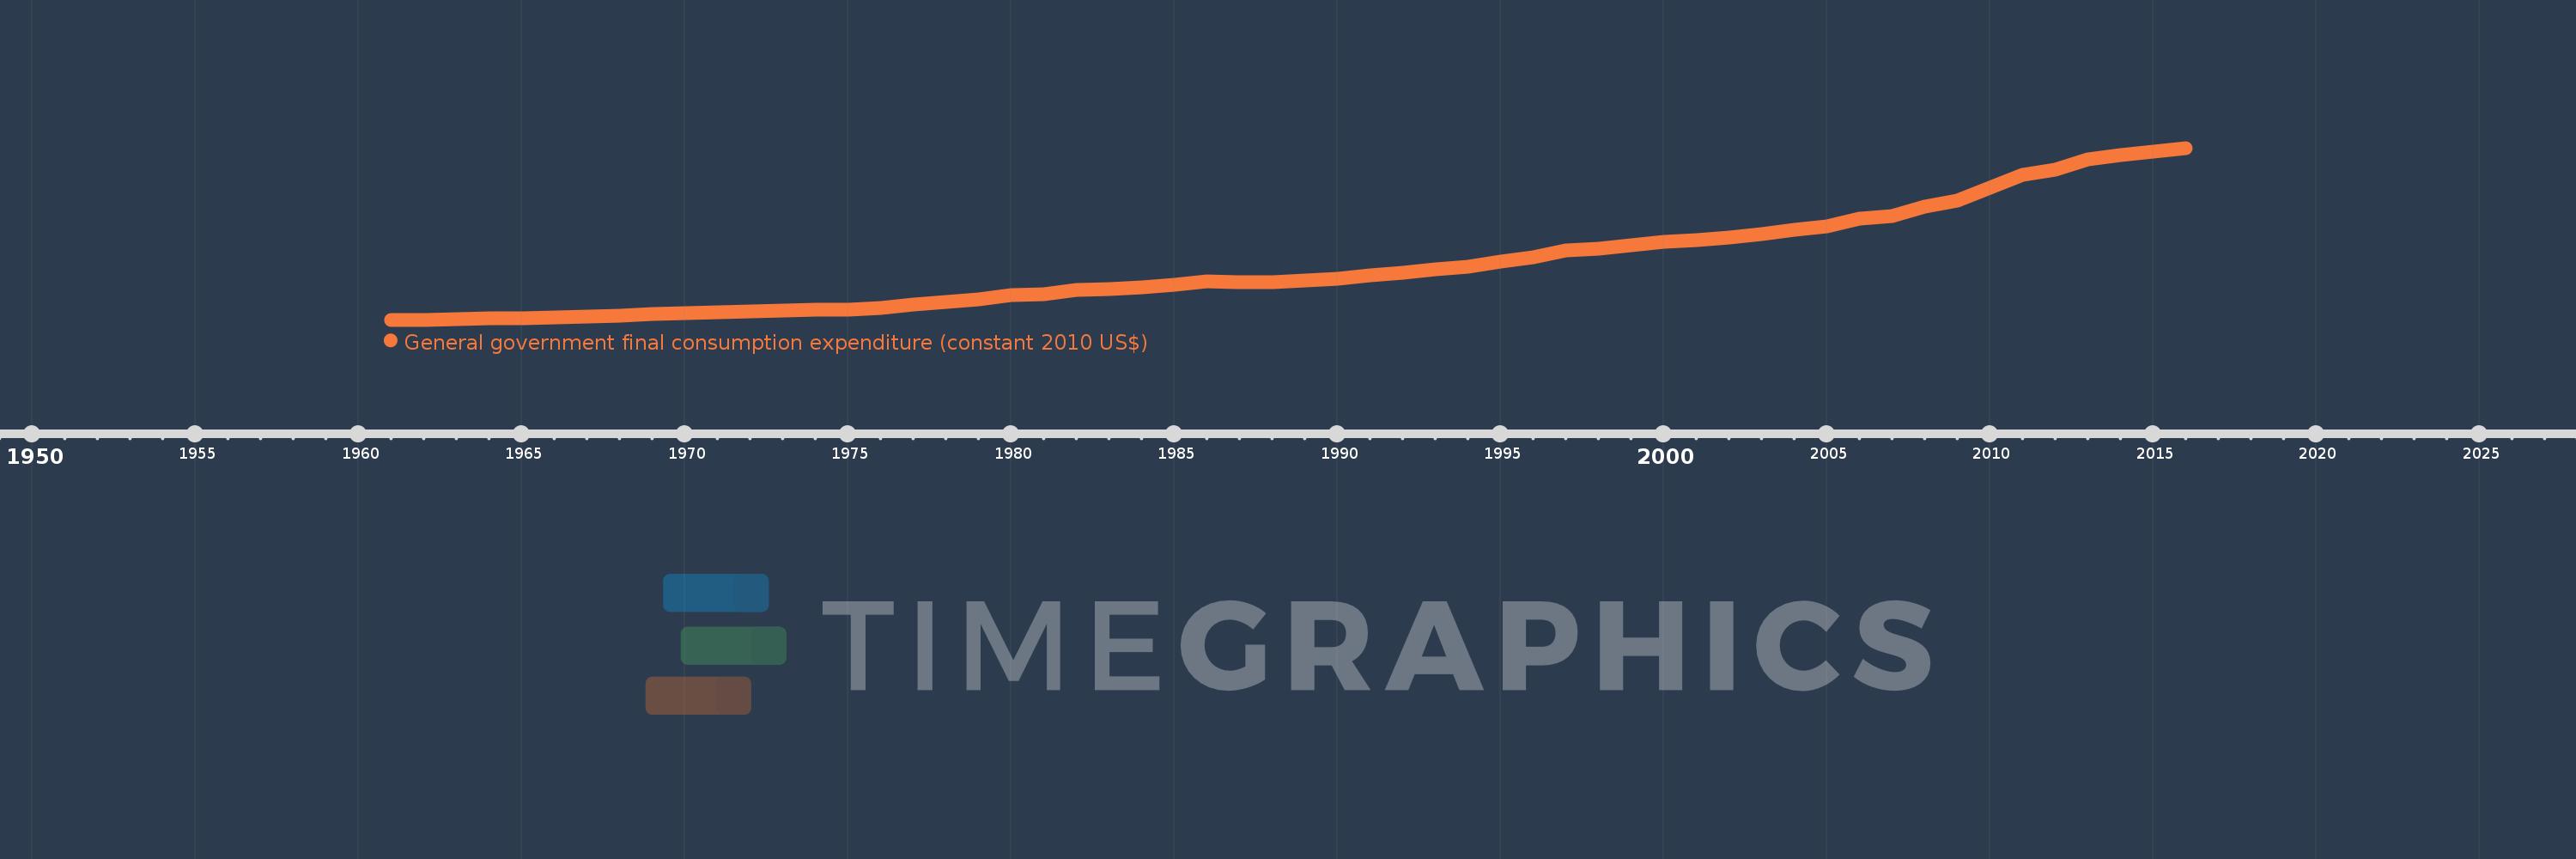
General government final consumption expenditure (constant 2010 US$)
2016,2015,2014,2013,2012,2011,2010,2009,2008,2007,2006,2005,2004,2003,2002,2001,2000,1999,1998,1997,1996,1995,1994,1993,1992,1991,1990,1989,1988,1987,1986,1985,1984,1983,1982,1981,1980,1979,1978,1977,1976,1975,1974,1973,1972,1971,1970,1969,1968,1967,1966,1965,1964,1963,1962,1961
This statistics in other country:
AfghanistanAlbaniaAlgeriaAngolaAntigua and BarbudaArab WorldArgentinaArmeniaArubaAustraliaAustriaAzerbaijanBahamas, TheBahrainBangladeshBarbadosBelarusBelgiumBelizeBeninBermudaBhutanBoliviaBosnia and HerzegovinaBotswanaBrazilBrunei DarussalamBulgariaBurkina FasoBurundiCabo VerdeCambodiaCameroonCanadaCaribbean small statesCentral African RepublicCentral Europe and the BalticsChadChileChinaColombiaComorosCongo, Dem. Rep.Congo, Rep.Costa RicaCote d'IvoireCroatiaCubaCyprusCzech RepublicDenmarkDominicaDominican RepublicEarly-demographic dividendEast Asia & PacificEast Asia & Pacific (excluding high income)East Asia & Pacific (IDA & IBRD countries)EcuadorEgypt, Arab Rep.El SalvadorEquatorial GuineaEritreaEstoniaEuro areaEurope & Central AsiaEurope & Central Asia (excluding high income)Europe & Central Asia (IDA & IBRD countries)European UnionFaroe IslandsFinlandFragile and conflict affected situationsFranceGabonGambia, TheGeorgiaGermanyGhanaGreeceGrenadaGuatemalaGuineaGuinea-BissauGuyanaHaitiHeavily indebted poor countries (HIPC)High incomeHondurasHong Kong SAR, ChinaHungaryIBRD onlyIcelandIDA & IBRD totalIDA blendIDA onlyIDA totalIndiaIndonesiaIran, Islamic Rep.IraqIrelandIsraelItalyJamaicaJapanJordanKazakhstanKenyaKorea, Rep.KosovoKuwaitKyrgyz RepublicLao PDRLate-demographic dividendLatin America & Caribbean Latin America & Caribbean (excluding high income)Latin America & the Caribbean (IDA & IBRD countries)LatviaLeast developed countries: UN classificationLebanonLiberiaLithuaniaLow & middle incomeLow incomeLower middle incomeLuxembourgMacao SAR, ChinaMacedonia, FYRMadagascarMalawiMalaysiaMaliMaltaMauritaniaMauritiusMexicoMiddle East & North AfricaMiddle East & North Africa (excluding high income)Middle East & North Africa (IDA & IBRD countries)Middle incomeMoldovaMongoliaMontenegroMoroccoMozambiqueNamibiaNepalNetherlandsNew ZealandNicaraguaNigerNigeriaNorth AmericaNorwayOECD membersOmanOther small statesPakistanPanamaParaguayPeruPhilippinesPolandPortugalPost-demographic dividendPre-demographic dividendPuerto RicoQatarRomaniaRussian FederationRwandaSaudi ArabiaSenegalSerbiaSeychellesSierra LeoneSingaporeSlovak RepublicSloveniaSmall statesSouth AfricaSouth AsiaSouth Asia (IDA & IBRD)South SudanSpainSri LankaSt. Kitts and NevisSt. LuciaSt. Vincent and the GrenadinesSub-Saharan Africa Sub-Saharan Africa (excluding high income)Sub-Saharan Africa (IDA & IBRD countries)SudanSurinameSwazilandSwedenSwitzerlandTajikistanTanzaniaThailandTimor-LesteTogoTongaTrinidad and TobagoTunisiaTurkeyTurkmenistanUgandaUkraineUnited Arab EmiratesUnited KingdomUnited StatesUpper middle incomeUruguayUzbekistanVanuatuVenezuela, RBVietnamWest Bank and GazaWorldYemen, Rep.ZambiaZimbabwe Timeline:
This timeline shows a graph from 1961 to 2016 of Thailand. No data until 1960. Number of actual observations by date: 56.
Source name:
World Development Indicators
Source organization:
World Bank national accounts data, and OECD National Accounts data files.
Categories, topics:
Economy & Growth
Last updated:
apr 23, 2017
Indicators value changes by year
Minimum:
1.906 bln
jan 1, 1961
Maximum:
63.798 bln
jan 1, 2016
At the date of observation
Value
Absolute change
Change from previous value
jan 1, 1961
1.906 bln
+1.906 bln
0.0%
jan 1, 1962
1.964 bln
+57.779 mln
3.03%
jan 1, 1963
2.166 bln
+202.187 mln
10.29%
jan 1, 1964
2.368 bln
+202.187 mln
9.33%
jan 1, 1965
2.513 bln
+144.407 mln
6.1%
jan 1, 1966
2.744 bln
+231.077 mln
9.2%
jan 1, 1967
3.004 bln
+259.966 mln
9.47%
jan 1, 1968
3.235 bln
+231.077 mln
7.69%
jan 1, 1969
3.899 bln
+664.309 mln
20.54%
jan 1, 1970
4.246 bln
+346.605 mln
8.89%
jan 1, 1971
4.728 bln
+481.692 mln
11.34%
jan 1, 1972
4.947 bln
+219.887 mln
4.65%
jan 1, 1973
5.112 bln
+164.917 mln
3.33%
jan 1, 1974
5.497 bln
+384.804 mln
7.53%
jan 1, 1975
5.47 bln
-27.485 mln
-0.5%
jan 1, 1976
6.239 bln
+769.608 mln
14.07%
jan 1, 1977
7.449 bln
+1.209 bln
19.38%
jan 1, 1978
8.218 bln
+769.618 mln
10.33%
jan 1, 1979
9.29 bln
+1.072 bln
13.04%
jan 1, 1980
10.747 bln
+1.457 bln
15.68%
jan 1, 1981
11.049 bln
+302.33 mln
2.81%
jan 1, 1982
12.699 bln
+1.65 bln
14.93%
jan 1, 1983
12.856 bln
+157.054 mln
1.24%
jan 1, 1984
13.531 bln
+675.231 mln
5.25%
jan 1, 1985
14.628 bln
+1.097 bln
8.1%
jan 1, 1986
15.628 bln
+1.0 bln
6.84%
jan 1, 1987
15.52 bln
-107.872 mln
-0.69%
jan 1, 1988
15.565 bln
+44.327 mln
0.29%
jan 1, 1989
16.192 bln
+627.494 mln
4.03%
jan 1, 1990
16.617 bln
+424.874 mln
2.62%
jan 1, 1991
17.766 bln
+1.149 bln
6.92%
jan 1, 1992
18.866 bln
+1.1 bln
6.19%
jan 1, 1993
20.074 bln
+1.208 bln
6.4%
jan 1, 1994
21.1 bln
+1.026 bln
5.11%
jan 1, 1995
22.885 bln
+1.785 bln
8.46%
jan 1, 1996
24.461 bln
+1.577 bln
6.89%
jan 1, 1997
26.861 bln
+2.399 bln
9.81%
jan 1, 1998
27.605 bln
+744.543 mln
2.77%
jan 1, 1999
28.877 bln
+1.272 bln
4.61%
jan 1, 2000
29.919 bln
+1.042 bln
3.61%
jan 1, 2001
30.744 bln
+825.449 mln
2.76%
jan 1, 2002
31.543 bln
+798.623 mln
2.6%
jan 1, 2003
32.619 bln
+1.076 bln
3.41%
jan 1, 2004
34.291 bln
+1.672 bln
5.13%
jan 1, 2005
35.627 bln
+1.336 bln
3.9%
jan 1, 2006
38.475 bln
+2.848 bln
7.99%
jan 1, 2007
39.347 bln
+871.288 mln
2.26%
jan 1, 2008
42.711 bln
+3.365 bln
8.55%
jan 1, 2009
44.815 bln
+2.104 bln
4.93%
jan 1, 2010
49.419 bln
+4.603 bln
10.27%
jan 1, 2011
54.028 bln
+4.609 bln
9.33%
jan 1, 2012
55.87 bln
+1.842 bln
3.41%
jan 1, 2013
59.669 bln
+3.799 bln
6.8%
jan 1, 2014
61.157 bln
+1.488 bln
2.49%
jan 1, 2015
62.424 bln
+1.267 bln
2.07%
jan 1, 2016
63.798 bln
+1.375 bln
2.2%
Ranking of countries by current statistics by years


Comments: