29
/
en
AIzaSyAYiBZKx7MnpbEhh9jyipgxe19OcubqV5w
April 1, 2024
59797
Sub-Saharan Africa (excluding high income)
SSA
false
2
1
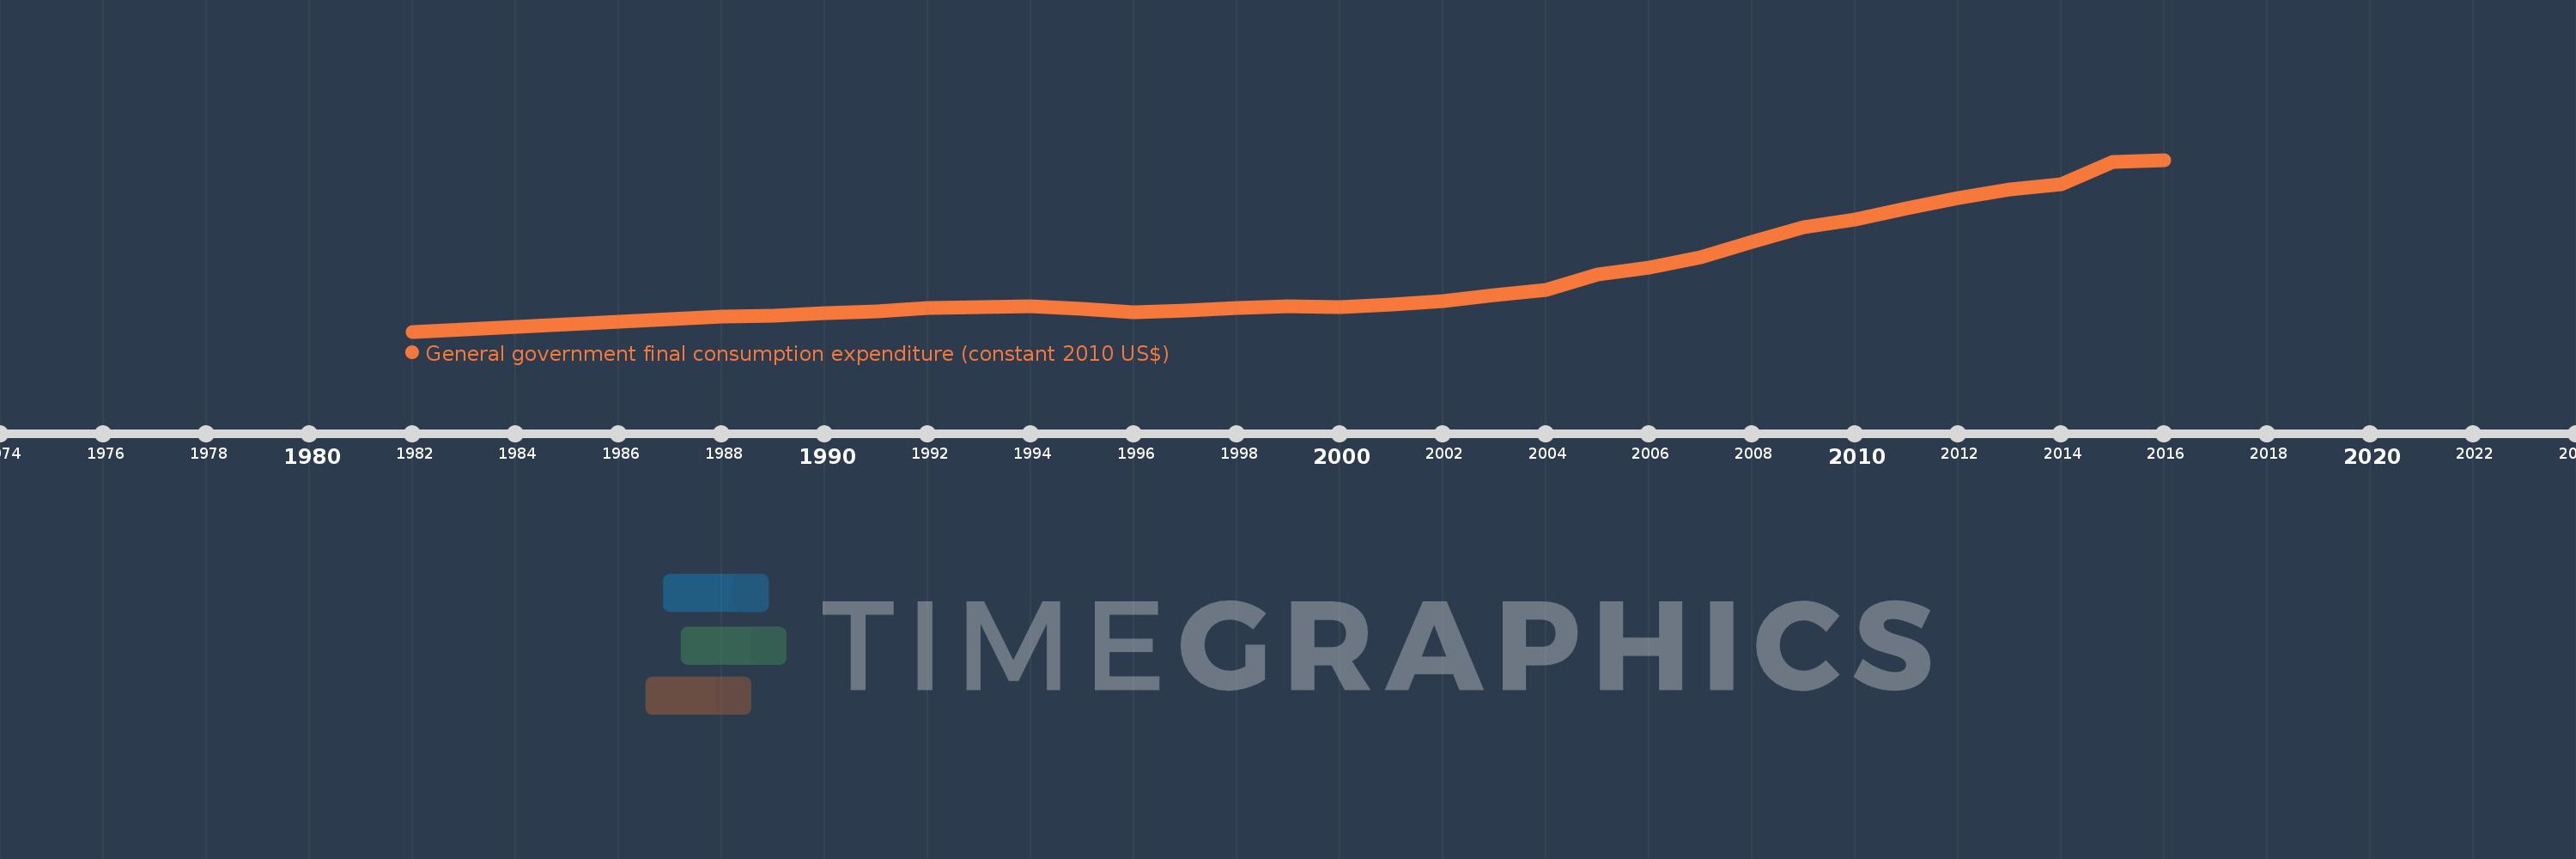
General government final consumption expenditure (constant 2010 US$)
2016,2015,2014,2013,2012,2011,2010,2009,2008,2007,2006,2005,2004,2003,2002,2001,2000,1999,1998,1997,1996,1995,1994,1993,1992,1991,1990,1989,1988,1987,1986,1985,1984,1983,1982
This statistics in other country:
AfghanistanAlbaniaAlgeriaAngolaAntigua and BarbudaArab WorldArgentinaArmeniaArubaAustraliaAustriaAzerbaijanBahamas, TheBahrainBangladeshBarbadosBelarusBelgiumBelizeBeninBermudaBhutanBoliviaBosnia and HerzegovinaBotswanaBrazilBrunei DarussalamBulgariaBurkina FasoBurundiCabo VerdeCambodiaCameroonCanadaCaribbean small statesCentral African RepublicCentral Europe and the BalticsChadChileChinaColombiaComorosCongo, Dem. Rep.Congo, Rep.Costa RicaCote d'IvoireCroatiaCubaCyprusCzech RepublicDenmarkDominicaDominican RepublicEarly-demographic dividendEast Asia & PacificEast Asia & Pacific (excluding high income)East Asia & Pacific (IDA & IBRD countries)EcuadorEgypt, Arab Rep.El SalvadorEquatorial GuineaEritreaEstoniaEuro areaEurope & Central AsiaEurope & Central Asia (excluding high income)Europe & Central Asia (IDA & IBRD countries)European UnionFaroe IslandsFinlandFragile and conflict affected situationsFranceGabonGambia, TheGeorgiaGermanyGhanaGreeceGrenadaGuatemalaGuineaGuinea-BissauGuyanaHaitiHeavily indebted poor countries (HIPC)High incomeHondurasHong Kong SAR, ChinaHungaryIBRD onlyIcelandIDA & IBRD totalIDA blendIDA onlyIDA totalIndiaIndonesiaIran, Islamic Rep.IraqIrelandIsraelItalyJamaicaJapanJordanKazakhstanKenyaKorea, Rep.KosovoKuwaitKyrgyz RepublicLao PDRLate-demographic dividendLatin America & Caribbean Latin America & Caribbean (excluding high income)Latin America & the Caribbean (IDA & IBRD countries)LatviaLeast developed countries: UN classificationLebanonLiberiaLithuaniaLow & middle incomeLow incomeLower middle incomeLuxembourgMacao SAR, ChinaMacedonia, FYRMadagascarMalawiMalaysiaMaliMaltaMauritaniaMauritiusMexicoMiddle East & North AfricaMiddle East & North Africa (excluding high income)Middle East & North Africa (IDA & IBRD countries)Middle incomeMoldovaMongoliaMontenegroMoroccoMozambiqueNamibiaNepalNetherlandsNew ZealandNicaraguaNigerNigeriaNorth AmericaNorwayOECD membersOmanOther small statesPakistanPanamaParaguayPeruPhilippinesPolandPortugalPost-demographic dividendPre-demographic dividendPuerto RicoQatarRomaniaRussian FederationRwandaSaudi ArabiaSenegalSerbiaSeychellesSierra LeoneSingaporeSlovak RepublicSloveniaSmall statesSouth AfricaSouth AsiaSouth Asia (IDA & IBRD)South SudanSpainSri LankaSt. Kitts and NevisSt. LuciaSt. Vincent and the GrenadinesSub-Saharan Africa Sub-Saharan Africa (excluding high income)Sub-Saharan Africa (IDA & IBRD countries)SudanSurinameSwazilandSwedenSwitzerlandTajikistanTanzaniaThailandTimor-LesteTogoTongaTrinidad and TobagoTunisiaTurkeyTurkmenistanUgandaUkraineUnited Arab EmiratesUnited KingdomUnited StatesUpper middle incomeUruguayUzbekistanVanuatuVenezuela, RBVietnamWest Bank and GazaWorldYemen, Rep.ZambiaZimbabwe Timeline:
This timeline shows a graph from 1982 to 2016 of Sub-Saharan Africa (excluding high income). No data until 1981. Number of actual observations by date: 35.
Source name:
World Development Indicators
Source organization:
World Bank national accounts data, and OECD National Accounts data files.
Categories, topics:
Economy & Growth
Last updated:
apr 23, 2017
Indicators value changes by year
Minimum:
67.379 bln
jan 1, 1982
Maximum:
245.495 bln
jan 1, 2016
At the date of observation
Value
Absolute change
Change from previous value
jan 1, 1982
67.379 bln
+67.379 bln
0.0%
jan 1, 1983
70.049 bln
+2.669 bln
3.96%
jan 1, 1984
71.838 bln
+1.79 bln
2.55%
jan 1, 1985
75.235 bln
+3.397 bln
4.73%
jan 1, 1986
77.91 bln
+2.675 bln
3.56%
jan 1, 1987
80.386 bln
+2.476 bln
3.18%
jan 1, 1988
82.595 bln
+2.209 bln
2.75%
jan 1, 1989
83.583 bln
+987.841 mln
1.2%
jan 1, 1990
86.191 bln
+2.608 bln
3.12%
jan 1, 1991
88.206 bln
+2.015 bln
2.34%
jan 1, 1992
91.597 bln
+3.39 bln
3.84%
jan 1, 1993
93.014 bln
+1.417 bln
1.55%
jan 1, 1994
93.975 bln
+961.217 mln
1.03%
jan 1, 1995
90.847 bln
-3.128 bln
-3.33%
jan 1, 1996
87.583 bln
-3.263 bln
-3.59%
jan 1, 1997
88.778 bln
+1.194 bln
1.36%
jan 1, 1998
91.852 bln
+3.075 bln
3.46%
jan 1, 1999
93.257 bln
+1.405 bln
1.53%
jan 1, 2000
92.743 bln
-514.079 mln
-0.55%
jan 1, 2001
95.229 bln
+2.486 bln
2.68%
jan 1, 2002
98.769 bln
+3.54 bln
3.72%
jan 1, 2003
105.244 bln
+6.474 bln
6.55%
jan 1, 2004
110.534 bln
+5.29 bln
5.03%
jan 1, 2005
126.754 bln
+16.22 bln
14.67%
jan 1, 2006
134.026 bln
+7.273 bln
5.74%
jan 1, 2007
144.721 bln
+10.695 bln
7.98%
jan 1, 2008
160.883 bln
+16.163 bln
11.17%
jan 1, 2009
175.595 bln
+14.712 bln
9.14%
jan 1, 2010
183.95 bln
+8.354 bln
4.76%
jan 1, 2011
194.896 bln
+10.946 bln
5.95%
jan 1, 2012
206.259 bln
+11.364 bln
5.83%
jan 1, 2013
214.557 bln
+8.298 bln
4.02%
jan 1, 2014
219.966 bln
+5.409 bln
2.52%
jan 1, 2015
243.193 bln
+23.227 bln
10.56%
jan 1, 2016
245.495 bln
+2.302 bln
0.95%
Ranking of countries by current statistics by years


Comments: