29
/
en
AIzaSyAYiBZKx7MnpbEhh9jyipgxe19OcubqV5w
April 1, 2024
223575
Philippines
PHL
true
2
1
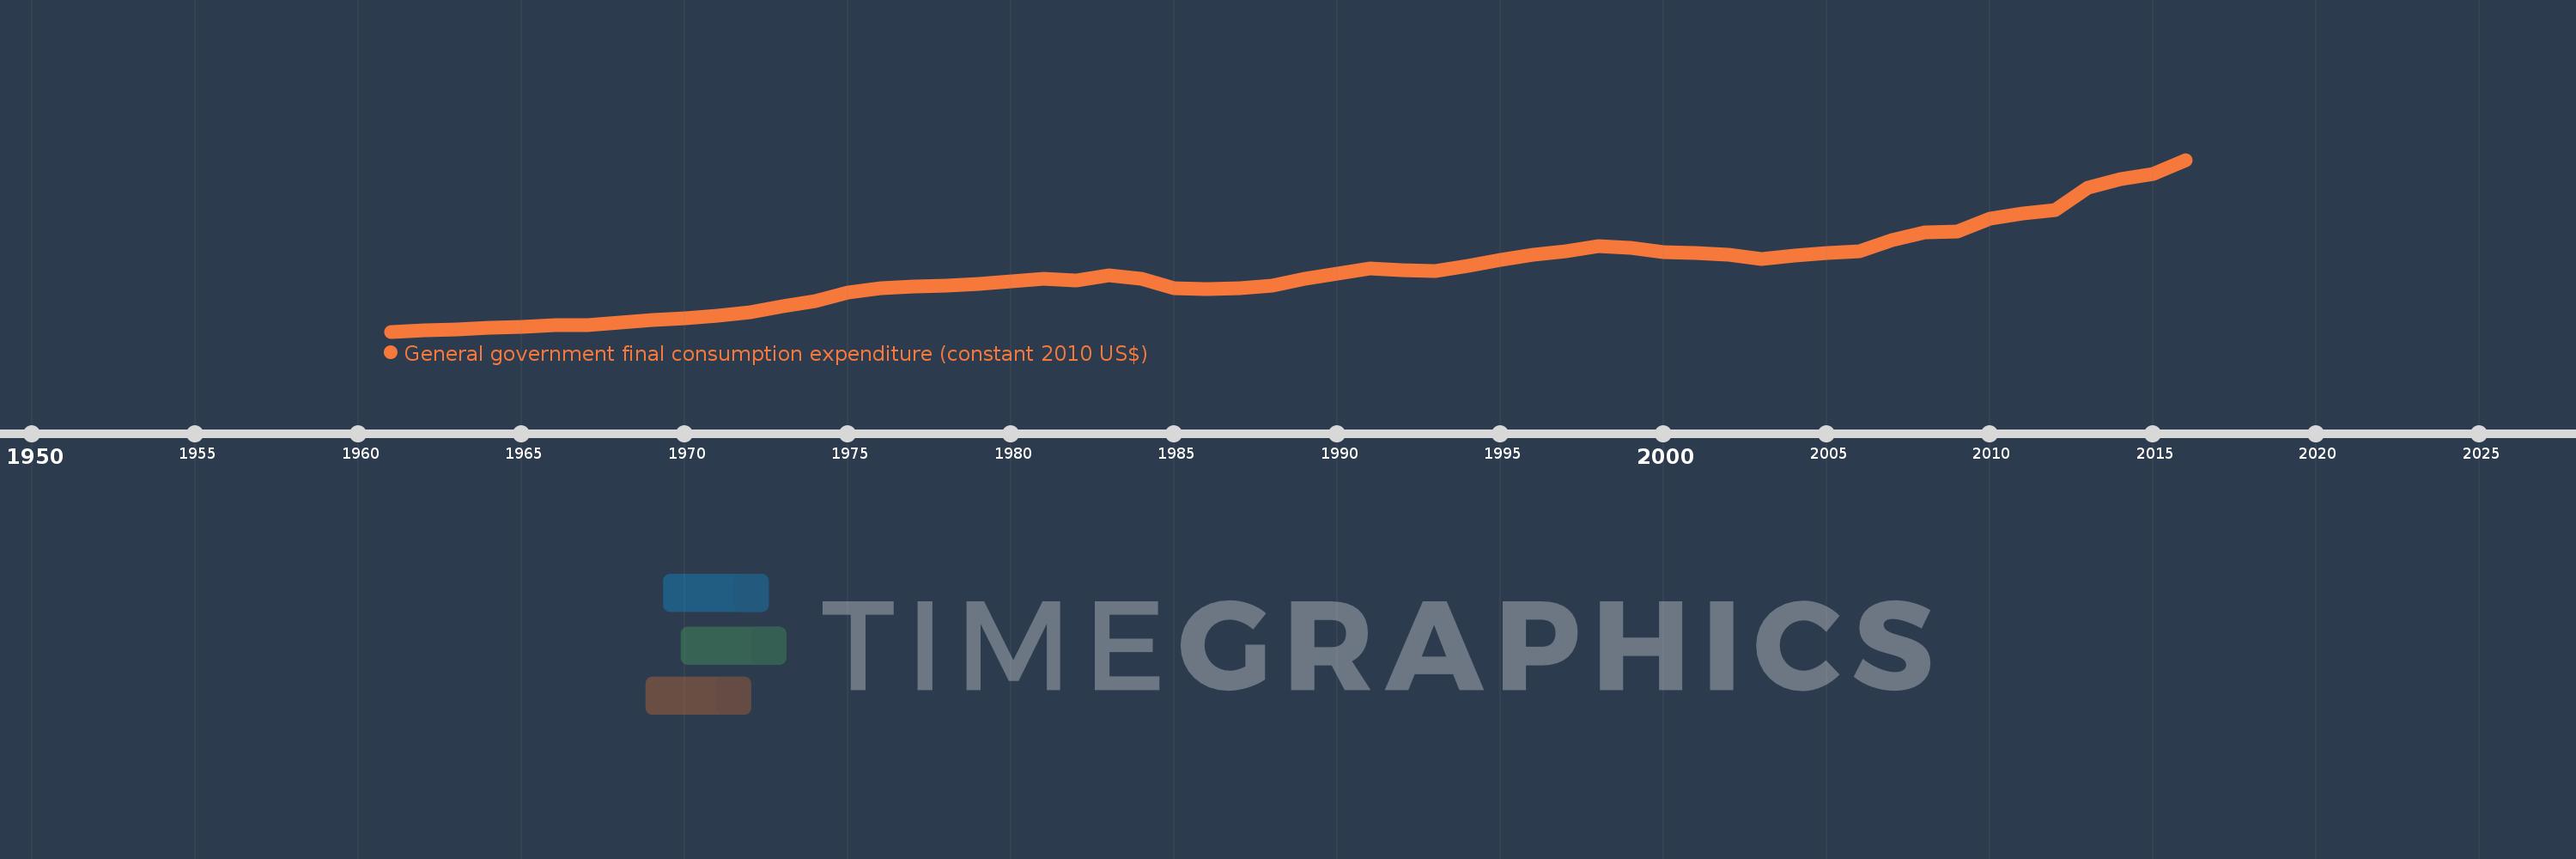
General government final consumption expenditure (constant 2010 US$)
2016,2015,2014,2013,2012,2011,2010,2009,2008,2007,2006,2005,2004,2003,2002,2001,2000,1999,1998,1997,1996,1995,1994,1993,1992,1991,1990,1989,1988,1987,1986,1985,1984,1983,1982,1981,1980,1979,1978,1977,1976,1975,1974,1973,1972,1971,1970,1969,1968,1967,1966,1965,1964,1963,1962,1961
This statistics in other country:
AfghanistanAlbaniaAlgeriaAngolaAntigua and BarbudaArab WorldArgentinaArmeniaArubaAustraliaAustriaAzerbaijanBahamas, TheBahrainBangladeshBarbadosBelarusBelgiumBelizeBeninBermudaBhutanBoliviaBosnia and HerzegovinaBotswanaBrazilBrunei DarussalamBulgariaBurkina FasoBurundiCabo VerdeCambodiaCameroonCanadaCaribbean small statesCentral African RepublicCentral Europe and the BalticsChadChileChinaColombiaComorosCongo, Dem. Rep.Congo, Rep.Costa RicaCote d'IvoireCroatiaCubaCyprusCzech RepublicDenmarkDominicaDominican RepublicEarly-demographic dividendEast Asia & PacificEast Asia & Pacific (excluding high income)East Asia & Pacific (IDA & IBRD countries)EcuadorEgypt, Arab Rep.El SalvadorEquatorial GuineaEritreaEstoniaEuro areaEurope & Central AsiaEurope & Central Asia (excluding high income)Europe & Central Asia (IDA & IBRD countries)European UnionFaroe IslandsFinlandFragile and conflict affected situationsFranceGabonGambia, TheGeorgiaGermanyGhanaGreeceGrenadaGuatemalaGuineaGuinea-BissauGuyanaHaitiHeavily indebted poor countries (HIPC)High incomeHondurasHong Kong SAR, ChinaHungaryIBRD onlyIcelandIDA & IBRD totalIDA blendIDA onlyIDA totalIndiaIndonesiaIran, Islamic Rep.IraqIrelandIsraelItalyJamaicaJapanJordanKazakhstanKenyaKorea, Rep.KosovoKuwaitKyrgyz RepublicLao PDRLate-demographic dividendLatin America & Caribbean Latin America & Caribbean (excluding high income)Latin America & the Caribbean (IDA & IBRD countries)LatviaLeast developed countries: UN classificationLebanonLiberiaLithuaniaLow & middle incomeLow incomeLower middle incomeLuxembourgMacao SAR, ChinaMacedonia, FYRMadagascarMalawiMalaysiaMaliMaltaMauritaniaMauritiusMexicoMiddle East & North AfricaMiddle East & North Africa (excluding high income)Middle East & North Africa (IDA & IBRD countries)Middle incomeMoldovaMongoliaMontenegroMoroccoMozambiqueNamibiaNepalNetherlandsNew ZealandNicaraguaNigerNigeriaNorth AmericaNorwayOECD membersOmanOther small statesPakistanPanamaParaguayPeruPhilippinesPolandPortugalPost-demographic dividendPre-demographic dividendPuerto RicoQatarRomaniaRussian FederationRwandaSaudi ArabiaSenegalSerbiaSeychellesSierra LeoneSingaporeSlovak RepublicSloveniaSmall statesSouth AfricaSouth AsiaSouth Asia (IDA & IBRD)South SudanSpainSri LankaSt. Kitts and NevisSt. LuciaSt. Vincent and the GrenadinesSub-Saharan Africa Sub-Saharan Africa (excluding high income)Sub-Saharan Africa (IDA & IBRD countries)SudanSurinameSwazilandSwedenSwitzerlandTajikistanTanzaniaThailandTimor-LesteTogoTongaTrinidad and TobagoTunisiaTurkeyTurkmenistanUgandaUkraineUnited Arab EmiratesUnited KingdomUnited StatesUpper middle incomeUruguayUzbekistanVanuatuVenezuela, RBVietnamWest Bank and GazaWorldYemen, Rep.ZambiaZimbabwe Timeline:
This timeline shows a graph from 1961 to 2016 of Philippines. No data until 1960. Number of actual observations by date: 56.
Source name:
World Development Indicators
Source organization:
World Bank national accounts data, and OECD National Accounts data files.
Categories, topics:
Economy & Growth
Last updated:
apr 23, 2017
Indicators value changes by year
Minimum:
3.131 bln
jan 1, 1961
Maximum:
26.725 bln
jan 1, 2016
At the date of observation
Value
Absolute change
Change from previous value
jan 1, 1961
3.131 bln
+3.131 bln
0.0%
jan 1, 1962
3.316 bln
+184.617 mln
5.9%
jan 1, 1963
3.406 bln
+90.234 mln
2.72%
jan 1, 1964
3.667 bln
+261.16 mln
7.67%
jan 1, 1965
3.816 bln
+149.145 mln
4.07%
jan 1, 1966
3.976 bln
+159.517 mln
4.18%
jan 1, 1967
3.977 bln
+1.245 mln
0.03%
jan 1, 1968
4.419 bln
+441.628 mln
11.1%
jan 1, 1969
4.729 bln
+310.115 mln
7.02%
jan 1, 1970
5.01 bln
+281.074 mln
5.94%
jan 1, 1971
5.334 bln
+323.805 mln
6.46%
jan 1, 1972
5.839 bln
+505.725 mln
9.48%
jan 1, 1973
6.601 bln
+761.699 mln
13.04%
jan 1, 1974
7.378 bln
+776.842 mln
11.77%
jan 1, 1975
8.463 bln
+1.086 bln
14.71%
jan 1, 1976
9.115 bln
+651.344 mln
7.7%
jan 1, 1977
9.307 bln
+191.877 mln
2.11%
jan 1, 1978
9.393 bln
+86.708 mln
0.93%
jan 1, 1979
9.676 bln
+282.318 mln
3.01%
jan 1, 1980
10.033 bln
+357.617 mln
3.7%
jan 1, 1981
10.408 bln
+375.249 mln
3.74%
jan 1, 1982
10.097 bln
-311.567 mln
-2.99%
jan 1, 1983
10.855 bln
+757.758 mln
7.5%
jan 1, 1984
10.341 bln
-513.193 mln
-4.73%
jan 1, 1985
9.121 bln
-1.22 bln
-11.8%
jan 1, 1986
9.028 bln
-93.553 mln
-1.03%
jan 1, 1987
9.058 bln
+30.908 mln
0.34%
jan 1, 1988
9.499 bln
+440.383 mln
4.86%
jan 1, 1989
10.36 bln
+861.06 mln
9.06%
jan 1, 1990
11.084 bln
+724.154 mln
6.99%
jan 1, 1991
11.832 bln
+748.424 mln
6.75%
jan 1, 1992
11.58 bln
-252.24 mln
-2.13%
jan 1, 1993
11.479 bln
-101.435 mln
-0.88%
jan 1, 1994
12.186 bln
+707.144 mln
6.16%
jan 1, 1995
12.932 bln
+746.142 mln
6.12%
jan 1, 1996
13.651 bln
+719.175 mln
5.56%
jan 1, 1997
14.215 bln
+563.599 mln
4.13%
jan 1, 1998
14.874 bln
+658.812 mln
4.63%
jan 1, 1999
14.584 bln
-289.993 mln
-1.95%
jan 1, 2000
14.054 bln
-529.462 mln
-3.63%
jan 1, 2001
13.92 bln
-134.685 mln
-0.96%
jan 1, 2002
13.697 bln
-223.027 mln
-1.6%
jan 1, 2003
13.152 bln
-544.008 mln
-3.97%
jan 1, 2004
13.627 bln
+474.129 mln
3.6%
jan 1, 2005
13.9 bln
+273.148 mln
2.0%
jan 1, 2006
14.186 bln
+285.875 mln
2.06%
jan 1, 2007
15.691 bln
+1.505 bln
10.61%
jan 1, 2008
16.774 bln
+1.083 bln
6.9%
jan 1, 2009
16.823 bln
+48.421 mln
0.29%
jan 1, 2010
18.658 bln
+1.835 bln
10.91%
jan 1, 2011
19.404 bln
+745.63 mln
4.0%
jan 1, 2012
19.808 bln
+404.629 mln
2.09%
jan 1, 2013
22.874 bln
+3.065 bln
15.47%
jan 1, 2014
24.018 bln
+1.145 bln
5.0%
jan 1, 2015
24.799 bln
+780.652 mln
3.25%
jan 1, 2016
26.725 bln
+1.926 bln
7.77%
Ranking of countries by current statistics by years


Comments: