29
/
en
AIzaSyAYiBZKx7MnpbEhh9jyipgxe19OcubqV5w
April 1, 2024
107258
Colombia
COL
true
2
1
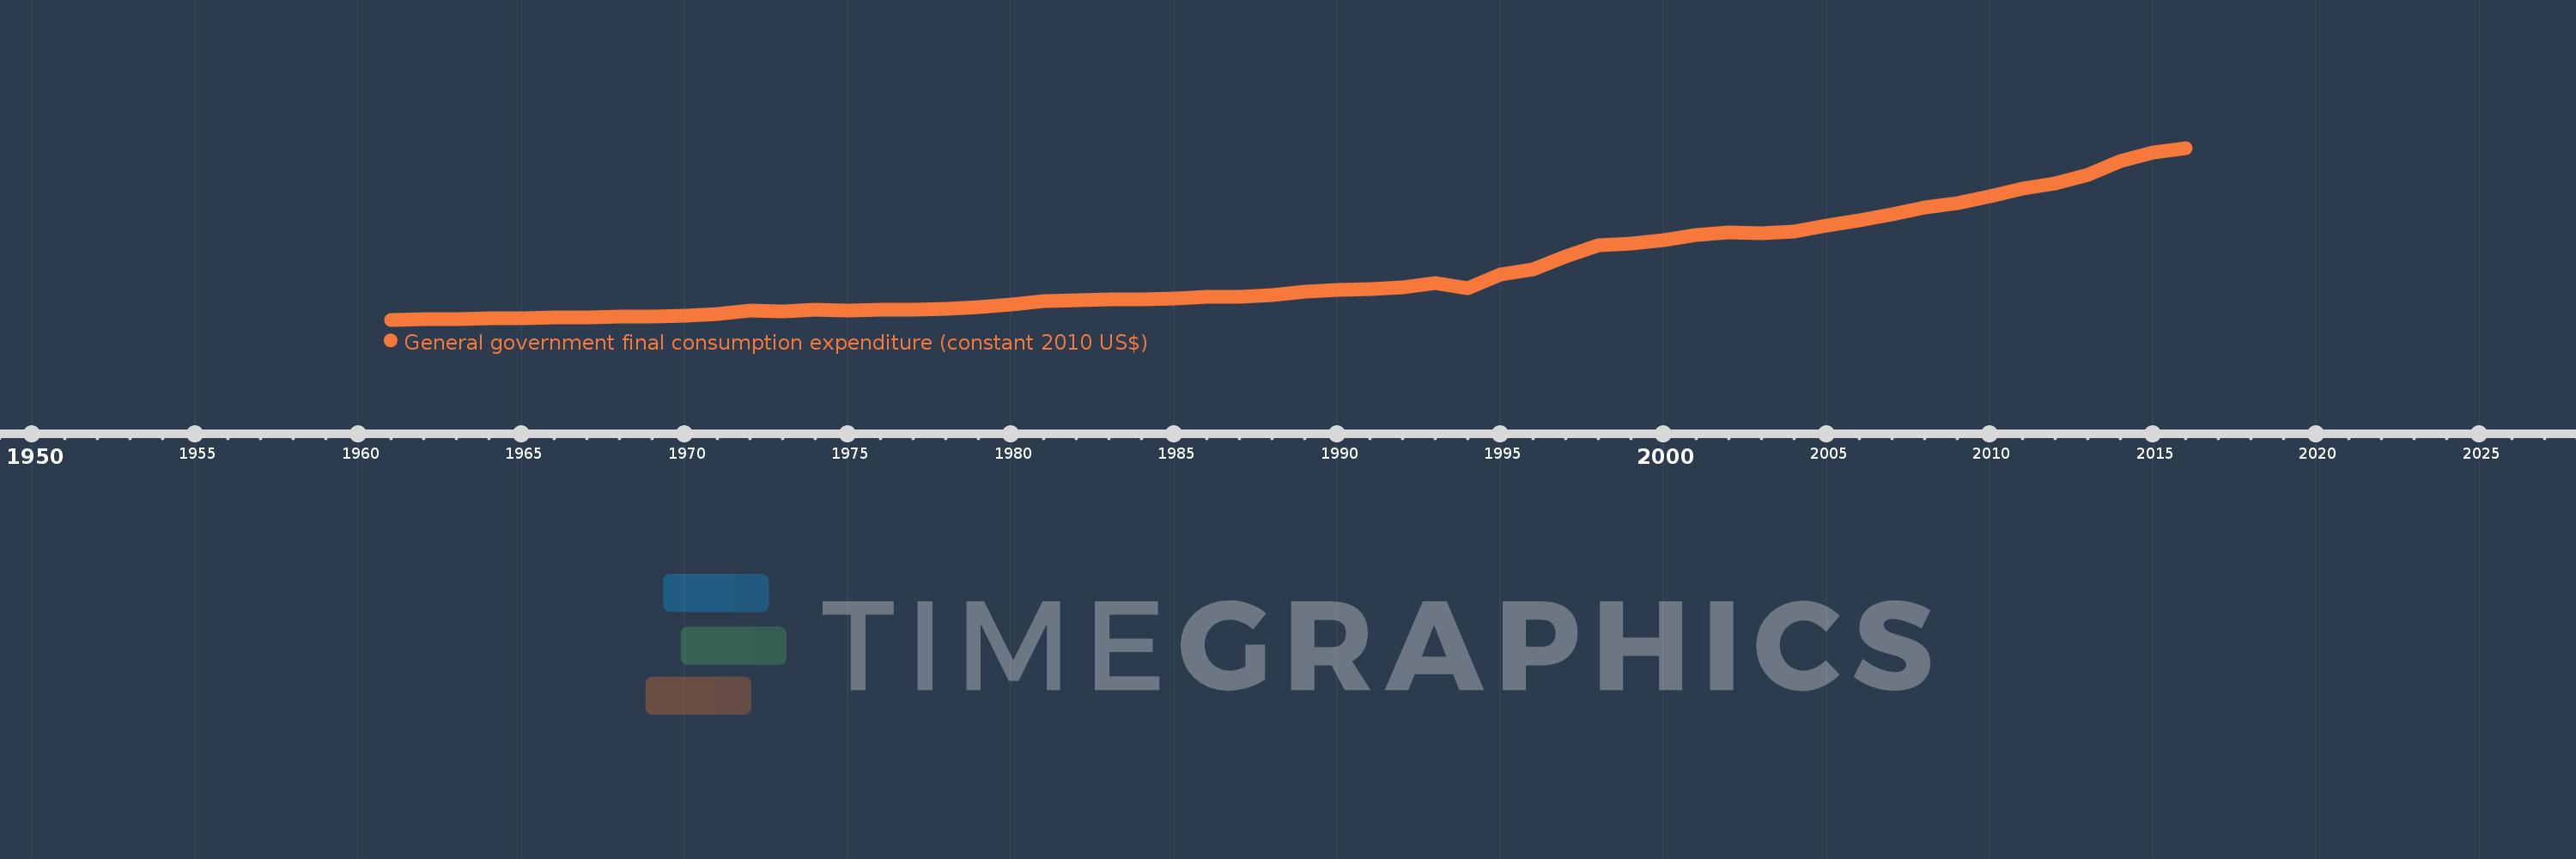
General government final consumption expenditure (constant 2010 US$)
2016,2015,2014,2013,2012,2011,2010,2009,2008,2007,2006,2005,2004,2003,2002,2001,2000,1999,1998,1997,1996,1995,1994,1993,1992,1991,1990,1989,1988,1987,1986,1985,1984,1983,1982,1981,1980,1979,1978,1977,1976,1975,1974,1973,1972,1971,1970,1969,1968,1967,1966,1965,1964,1963,1962,1961
This statistics in other country:
AfghanistanAlbaniaAlgeriaAngolaAntigua and BarbudaArab WorldArgentinaArmeniaArubaAustraliaAustriaAzerbaijanBahamas, TheBahrainBangladeshBarbadosBelarusBelgiumBelizeBeninBermudaBhutanBoliviaBosnia and HerzegovinaBotswanaBrazilBrunei DarussalamBulgariaBurkina FasoBurundiCabo VerdeCambodiaCameroonCanadaCaribbean small statesCentral African RepublicCentral Europe and the BalticsChadChileChinaColombiaComorosCongo, Dem. Rep.Congo, Rep.Costa RicaCote d'IvoireCroatiaCubaCyprusCzech RepublicDenmarkDominicaDominican RepublicEarly-demographic dividendEast Asia & PacificEast Asia & Pacific (excluding high income)East Asia & Pacific (IDA & IBRD countries)EcuadorEgypt, Arab Rep.El SalvadorEquatorial GuineaEritreaEstoniaEuro areaEurope & Central AsiaEurope & Central Asia (excluding high income)Europe & Central Asia (IDA & IBRD countries)European UnionFaroe IslandsFinlandFragile and conflict affected situationsFranceGabonGambia, TheGeorgiaGermanyGhanaGreeceGrenadaGuatemalaGuineaGuinea-BissauGuyanaHaitiHeavily indebted poor countries (HIPC)High incomeHondurasHong Kong SAR, ChinaHungaryIBRD onlyIcelandIDA & IBRD totalIDA blendIDA onlyIDA totalIndiaIndonesiaIran, Islamic Rep.IraqIrelandIsraelItalyJamaicaJapanJordanKazakhstanKenyaKorea, Rep.KosovoKuwaitKyrgyz RepublicLao PDRLate-demographic dividendLatin America & Caribbean Latin America & Caribbean (excluding high income)Latin America & the Caribbean (IDA & IBRD countries)LatviaLeast developed countries: UN classificationLebanonLiberiaLithuaniaLow & middle incomeLow incomeLower middle incomeLuxembourgMacao SAR, ChinaMacedonia, FYRMadagascarMalawiMalaysiaMaliMaltaMauritaniaMauritiusMexicoMiddle East & North AfricaMiddle East & North Africa (excluding high income)Middle East & North Africa (IDA & IBRD countries)Middle incomeMoldovaMongoliaMontenegroMoroccoMozambiqueNamibiaNepalNetherlandsNew ZealandNicaraguaNigerNigeriaNorth AmericaNorwayOECD membersOmanOther small statesPakistanPanamaParaguayPeruPhilippinesPolandPortugalPost-demographic dividendPre-demographic dividendPuerto RicoQatarRomaniaRussian FederationRwandaSaudi ArabiaSenegalSerbiaSeychellesSierra LeoneSingaporeSlovak RepublicSloveniaSmall statesSouth AfricaSouth AsiaSouth Asia (IDA & IBRD)South SudanSpainSri LankaSt. Kitts and NevisSt. LuciaSt. Vincent and the GrenadinesSub-Saharan Africa Sub-Saharan Africa (excluding high income)Sub-Saharan Africa (IDA & IBRD countries)SudanSurinameSwazilandSwedenSwitzerlandTajikistanTanzaniaThailandTimor-LesteTogoTongaTrinidad and TobagoTunisiaTurkeyTurkmenistanUgandaUkraineUnited Arab EmiratesUnited KingdomUnited StatesUpper middle incomeUruguayUzbekistanVanuatuVenezuela, RBVietnamWest Bank and GazaWorldYemen, Rep.ZambiaZimbabwe Timeline:
This timeline shows a graph from 1961 to 2016 of Colombia. No data until 1960. Number of actual observations by date: 56.
Source name:
World Development Indicators
Source organization:
World Bank national accounts data, and OECD National Accounts data files.
Categories, topics:
Economy & Growth
Last updated:
apr 23, 2017
Indicators value changes by year
Minimum:
2.44 bln
jan 1, 1961
Maximum:
62.951 bln
jan 1, 2016
At the date of observation
Value
Absolute change
Change from previous value
jan 1, 1961
2.44 bln
+2.44 bln
0.0%
jan 1, 1962
2.574 bln
+134.056 mln
5.49%
jan 1, 1963
2.789 bln
+214.913 mln
8.35%
jan 1, 1964
2.95 bln
+160.737 mln
5.76%
jan 1, 1965
2.99 bln
+39.696 mln
1.35%
jan 1, 1966
3.184 bln
+194.751 mln
6.51%
jan 1, 1967
3.331 bln
+146.977 mln
4.62%
jan 1, 1968
3.511 bln
+179.638 mln
5.39%
jan 1, 1969
3.625 bln
+114.315 mln
3.26%
jan 1, 1970
3.903 bln
+277.623 mln
7.66%
jan 1, 1971
4.458 bln
+555.245 mln
14.23%
jan 1, 1972
5.634 bln
+1.176 bln
26.37%
jan 1, 1973
5.356 bln
-277.623 mln
-4.93%
jan 1, 1974
5.912 bln
+555.245 mln
10.37%
jan 1, 1975
5.781 bln
-130.646 mln
-2.21%
jan 1, 1976
5.912 bln
+130.646 mln
2.26%
jan 1, 1977
6.124 bln
+212.299 mln
3.59%
jan 1, 1978
6.418 bln
+293.954 mln
4.8%
jan 1, 1979
7.006 bln
+587.906 mln
9.16%
jan 1, 1980
7.888 bln
+881.86 mln
12.59%
jan 1, 1981
8.884 bln
+996.175 mln
12.63%
jan 1, 1982
9.211 bln
+326.615 mln
3.68%
jan 1, 1983
9.635 bln
+424.599 mln
4.61%
jan 1, 1984
9.586 bln
-48.992 mln
-0.51%
jan 1, 1985
9.978 bln
+391.937 mln
4.09%
jan 1, 1986
10.419 bln
+440.93 mln
4.42%
jan 1, 1987
10.566 bln
+146.976 mln
1.41%
jan 1, 1988
11.154 bln
+587.907 mln
5.56%
jan 1, 1989
12.264 bln
+1.11 bln
9.96%
jan 1, 1990
12.95 bln
+685.892 mln
5.59%
jan 1, 1991
13.342 bln
+391.938 mln
3.03%
jan 1, 1992
13.783 bln
+440.929 mln
3.3%
jan 1, 1993
15.237 bln
+1.453 bln
10.55%
jan 1, 1994
13.679 bln
-1.558 bln
-10.23%
jan 1, 1995
18.464 bln
+4.785 bln
34.98%
jan 1, 1996
20.125 bln
+1.661 bln
9.0%
jan 1, 1997
24.776 bln
+4.651 bln
23.11%
jan 1, 1998
28.647 bln
+3.87 bln
15.62%
jan 1, 1999
29.259 bln
+612.558 mln
2.14%
jan 1, 2000
30.354 bln
+1.095 bln
3.74%
jan 1, 2001
32.453 bln
+2.099 bln
6.91%
jan 1, 2002
33.164 bln
+711.214 mln
2.19%
jan 1, 2003
33.015 bln
-149.148 mln
-0.45%
jan 1, 2004
33.599 bln
+584.162 mln
1.77%
jan 1, 2005
35.724 bln
+2.125 bln
6.33%
jan 1, 2006
37.587 bln
+1.862 bln
5.21%
jan 1, 2007
39.693 bln
+2.106 bln
5.6%
jan 1, 2008
42.074 bln
+2.382 bln
6.0%
jan 1, 2009
43.45 bln
+1.376 bln
3.27%
jan 1, 2010
46.002 bln
+2.551 bln
5.87%
jan 1, 2011
48.588 bln
+2.586 bln
5.62%
jan 1, 2012
50.324 bln
+1.737 bln
3.57%
jan 1, 2013
53.495 bln
+3.171 bln
6.3%
jan 1, 2014
58.435 bln
+4.94 bln
9.23%
jan 1, 2015
61.209 bln
+2.774 bln
4.75%
jan 1, 2016
62.951 bln
+1.741 bln
2.85%
Ranking of countries by current statistics by years


Comments: