29
/
en
AIzaSyAYiBZKx7MnpbEhh9jyipgxe19OcubqV5w
April 1, 2024
195561
Mexico
MEX
true
2
1
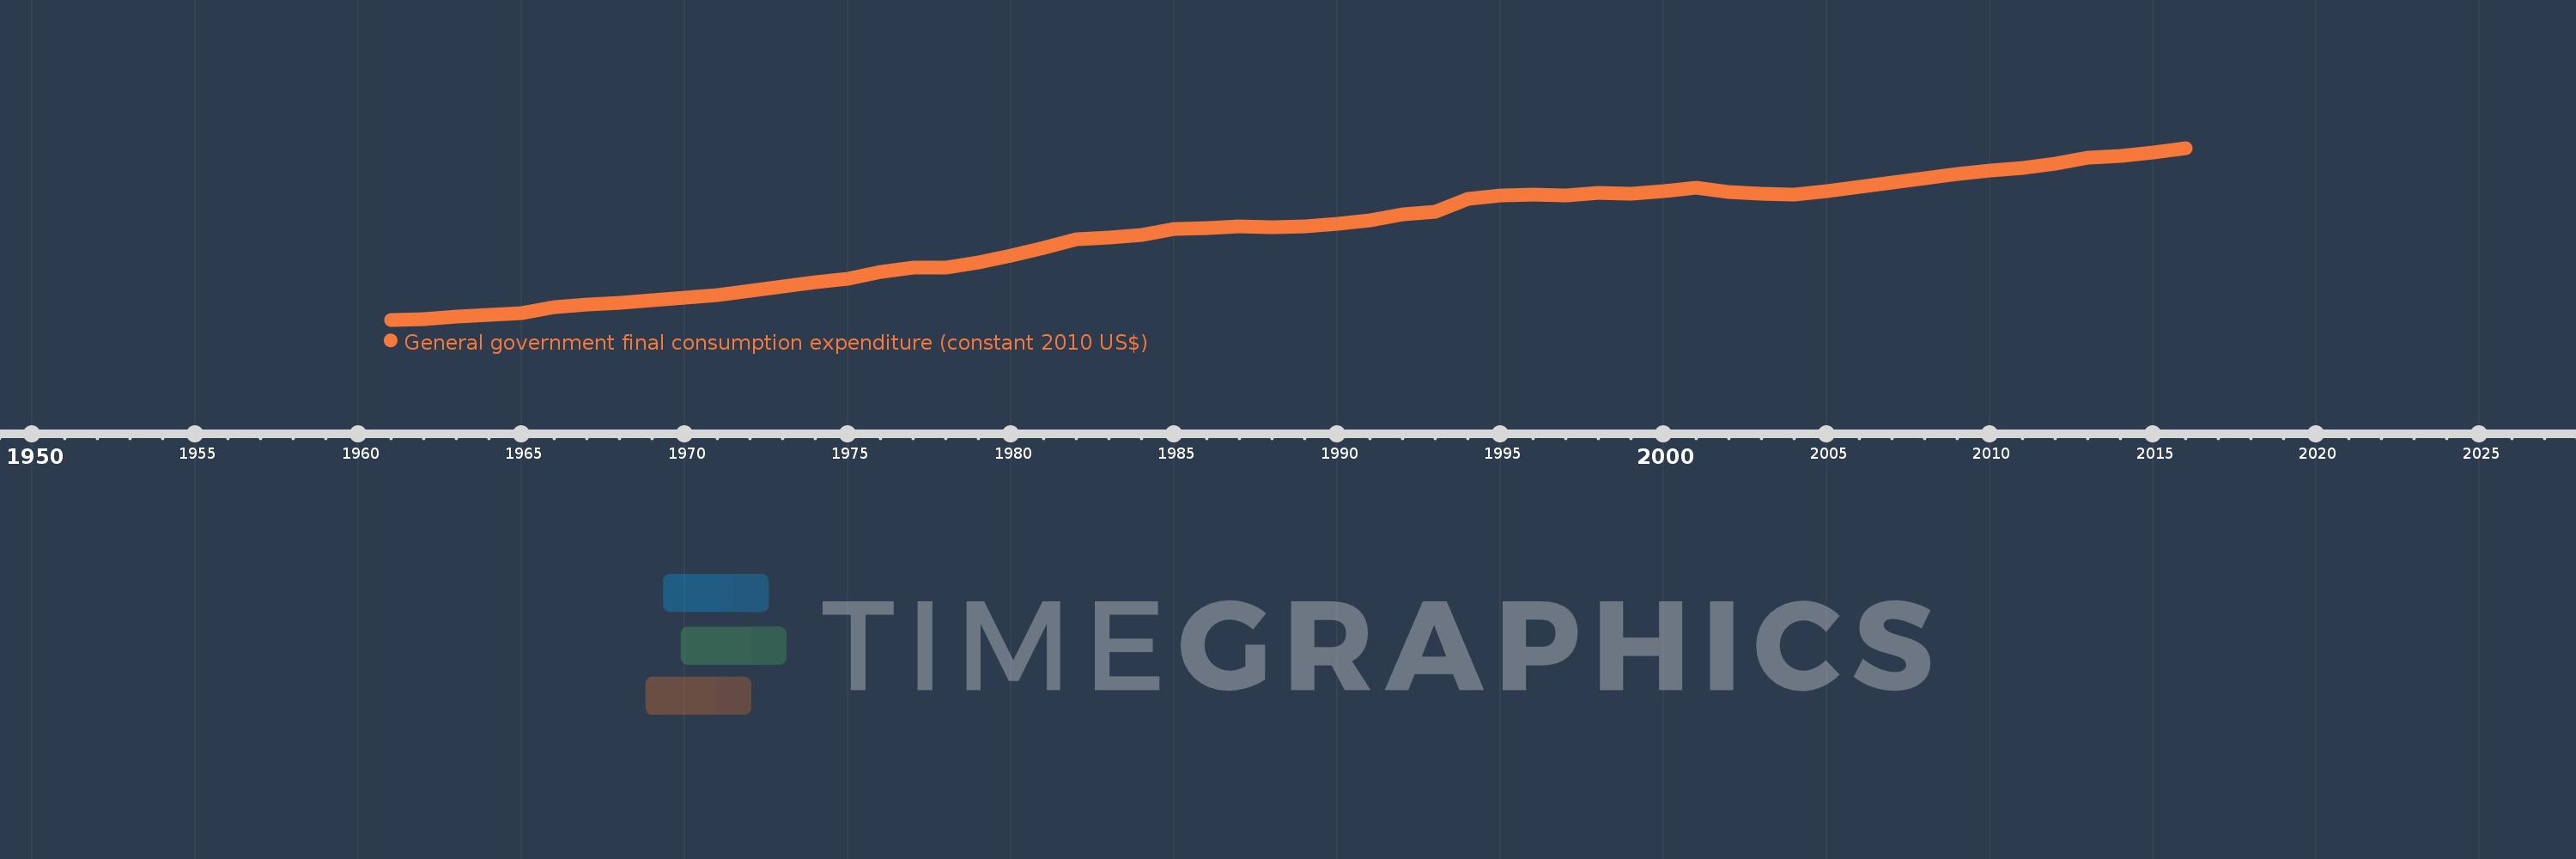
General government final consumption expenditure (constant 2010 US$)
2016,2015,2014,2013,2012,2011,2010,2009,2008,2007,2006,2005,2004,2003,2002,2001,2000,1999,1998,1997,1996,1995,1994,1993,1992,1991,1990,1989,1988,1987,1986,1985,1984,1983,1982,1981,1980,1979,1978,1977,1976,1975,1974,1973,1972,1971,1970,1969,1968,1967,1966,1965,1964,1963,1962,1961
This statistics in other country:
AfghanistanAlbaniaAlgeriaAngolaAntigua and BarbudaArab WorldArgentinaArmeniaArubaAustraliaAustriaAzerbaijanBahamas, TheBahrainBangladeshBarbadosBelarusBelgiumBelizeBeninBermudaBhutanBoliviaBosnia and HerzegovinaBotswanaBrazilBrunei DarussalamBulgariaBurkina FasoBurundiCabo VerdeCambodiaCameroonCanadaCaribbean small statesCentral African RepublicCentral Europe and the BalticsChadChileChinaColombiaComorosCongo, Dem. Rep.Congo, Rep.Costa RicaCote d'IvoireCroatiaCubaCyprusCzech RepublicDenmarkDominicaDominican RepublicEarly-demographic dividendEast Asia & PacificEast Asia & Pacific (excluding high income)East Asia & Pacific (IDA & IBRD countries)EcuadorEgypt, Arab Rep.El SalvadorEquatorial GuineaEritreaEstoniaEuro areaEurope & Central AsiaEurope & Central Asia (excluding high income)Europe & Central Asia (IDA & IBRD countries)European UnionFaroe IslandsFinlandFragile and conflict affected situationsFranceGabonGambia, TheGeorgiaGermanyGhanaGreeceGrenadaGuatemalaGuineaGuinea-BissauGuyanaHaitiHeavily indebted poor countries (HIPC)High incomeHondurasHong Kong SAR, ChinaHungaryIBRD onlyIcelandIDA & IBRD totalIDA blendIDA onlyIDA totalIndiaIndonesiaIran, Islamic Rep.IraqIrelandIsraelItalyJamaicaJapanJordanKazakhstanKenyaKorea, Rep.KosovoKuwaitKyrgyz RepublicLao PDRLate-demographic dividendLatin America & Caribbean Latin America & Caribbean (excluding high income)Latin America & the Caribbean (IDA & IBRD countries)LatviaLeast developed countries: UN classificationLebanonLiberiaLithuaniaLow & middle incomeLow incomeLower middle incomeLuxembourgMacao SAR, ChinaMacedonia, FYRMadagascarMalawiMalaysiaMaliMaltaMauritaniaMauritiusMexicoMiddle East & North AfricaMiddle East & North Africa (excluding high income)Middle East & North Africa (IDA & IBRD countries)Middle incomeMoldovaMongoliaMontenegroMoroccoMozambiqueNamibiaNepalNetherlandsNew ZealandNicaraguaNigerNigeriaNorth AmericaNorwayOECD membersOmanOther small statesPakistanPanamaParaguayPeruPhilippinesPolandPortugalPost-demographic dividendPre-demographic dividendPuerto RicoQatarRomaniaRussian FederationRwandaSaudi ArabiaSenegalSerbiaSeychellesSierra LeoneSingaporeSlovak RepublicSloveniaSmall statesSouth AfricaSouth AsiaSouth Asia (IDA & IBRD)South SudanSpainSri LankaSt. Kitts and NevisSt. LuciaSt. Vincent and the GrenadinesSub-Saharan Africa Sub-Saharan Africa (excluding high income)Sub-Saharan Africa (IDA & IBRD countries)SudanSurinameSwazilandSwedenSwitzerlandTajikistanTanzaniaThailandTimor-LesteTogoTongaTrinidad and TobagoTunisiaTurkeyTurkmenistanUgandaUkraineUnited Arab EmiratesUnited KingdomUnited StatesUpper middle incomeUruguayUzbekistanVanuatuVenezuela, RBVietnamWest Bank and GazaWorldYemen, Rep.ZambiaZimbabwe Timeline:
This timeline shows a graph from 1961 to 2016 of Mexico. No data until 1960. Number of actual observations by date: 56.
Source name:
World Development Indicators
Source organization:
World Bank national accounts data, and OECD National Accounts data files.
Categories, topics:
Economy & Growth
Last updated:
apr 23, 2017
Indicators value changes by year
Minimum:
8.817 bln
jan 1, 1961
Maximum:
137.182 bln
jan 1, 2016
At the date of observation
Value
Absolute change
Change from previous value
jan 1, 1961
8.817 bln
+8.817 bln
0.0%
jan 1, 1962
9.479 bln
+661.665 mln
7.5%
jan 1, 1963
10.929 bln
+1.45 bln
15.3%
jan 1, 1964
12.281 bln
+1.353 bln
12.38%
jan 1, 1965
13.782 bln
+1.501 bln
12.22%
jan 1, 1966
18.475 bln
+4.693 bln
34.05%
jan 1, 1967
20.213 bln
+1.737 bln
9.4%
jan 1, 1968
21.547 bln
+1.335 bln
6.6%
jan 1, 1969
23.698 bln
+2.151 bln
9.98%
jan 1, 1970
25.039 bln
+1.341 bln
5.66%
jan 1, 1971
27.311 bln
+2.272 bln
9.08%
jan 1, 1972
30.167 bln
+2.855 bln
10.45%
jan 1, 1973
33.828 bln
+3.662 bln
12.14%
jan 1, 1974
36.978 bln
+3.15 bln
9.31%
jan 1, 1975
39.426 bln
+2.448 bln
6.62%
jan 1, 1976
44.42 bln
+4.994 bln
12.67%
jan 1, 1977
47.468 bln
+3.049 bln
6.86%
jan 1, 1978
47.463 bln
-5.003 mln
-0.01%
jan 1, 1979
51.947 bln
+4.483 bln
9.45%
jan 1, 1980
56.925 bln
+4.978 bln
9.58%
jan 1, 1981
62.358 bln
+5.433 bln
9.54%
jan 1, 1982
68.764 bln
+6.405 bln
10.27%
jan 1, 1983
70.159 bln
+1.395 bln
2.03%
jan 1, 1984
72.07 bln
+1.91 bln
2.72%
jan 1, 1985
76.817 bln
+4.747 bln
6.59%
jan 1, 1986
77.513 bln
+695.784 mln
0.91%
jan 1, 1987
78.66 bln
+1.147 bln
1.48%
jan 1, 1988
77.712 bln
-948.139 mln
-1.21%
jan 1, 1989
78.71 bln
+997.47 mln
1.28%
jan 1, 1990
80.439 bln
+1.729 bln
2.2%
jan 1, 1991
83.121 bln
+2.682 bln
3.33%
jan 1, 1992
87.631 bln
+4.51 bln
5.43%
jan 1, 1993
89.26 bln
+1.629 bln
1.86%
jan 1, 1994
99.172 bln
+9.912 bln
11.1%
jan 1, 1995
101.41 bln
+2.239 bln
2.26%
jan 1, 1996
102.046 bln
+635.261 mln
0.63%
jan 1, 1997
101.838 bln
-207.7 mln
-0.2%
jan 1, 1998
103.564 bln
+1.726 bln
1.69%
jan 1, 1999
102.776 bln
-787.928 mln
-0.76%
jan 1, 2000
104.581 bln
+1.806 bln
1.76%
jan 1, 2001
107.484 bln
+2.903 bln
2.78%
jan 1, 2002
104.116 bln
-3.368 bln
-3.13%
jan 1, 2003
102.877 bln
-1.239 bln
-1.19%
jan 1, 2004
102.318 bln
-558.917 mln
-0.54%
jan 1, 2005
104.762 bln
+2.444 bln
2.39%
jan 1, 2006
107.955 bln
+3.193 bln
3.05%
jan 1, 2007
111.624 bln
+3.668 bln
3.4%
jan 1, 2008
114.362 bln
+2.738 bln
2.45%
jan 1, 2009
117.832 bln
+3.47 bln
3.03%
jan 1, 2010
120.481 bln
+2.649 bln
2.25%
jan 1, 2011
122.543 bln
+2.061 bln
1.71%
jan 1, 2012
125.543 bln
+3.001 bln
2.45%
jan 1, 2013
129.914 bln
+4.37 bln
3.48%
jan 1, 2014
131.267 bln
+1.354 bln
1.04%
jan 1, 2015
134.079 bln
+2.811 bln
2.14%
jan 1, 2016
137.182 bln
+3.103 bln
2.31%
Ranking of countries by current statistics by years


Comments: