29
/
en
AIzaSyAYiBZKx7MnpbEhh9jyipgxe19OcubqV5w
April 1, 2024
141819
Greece
GRC
true
2
1
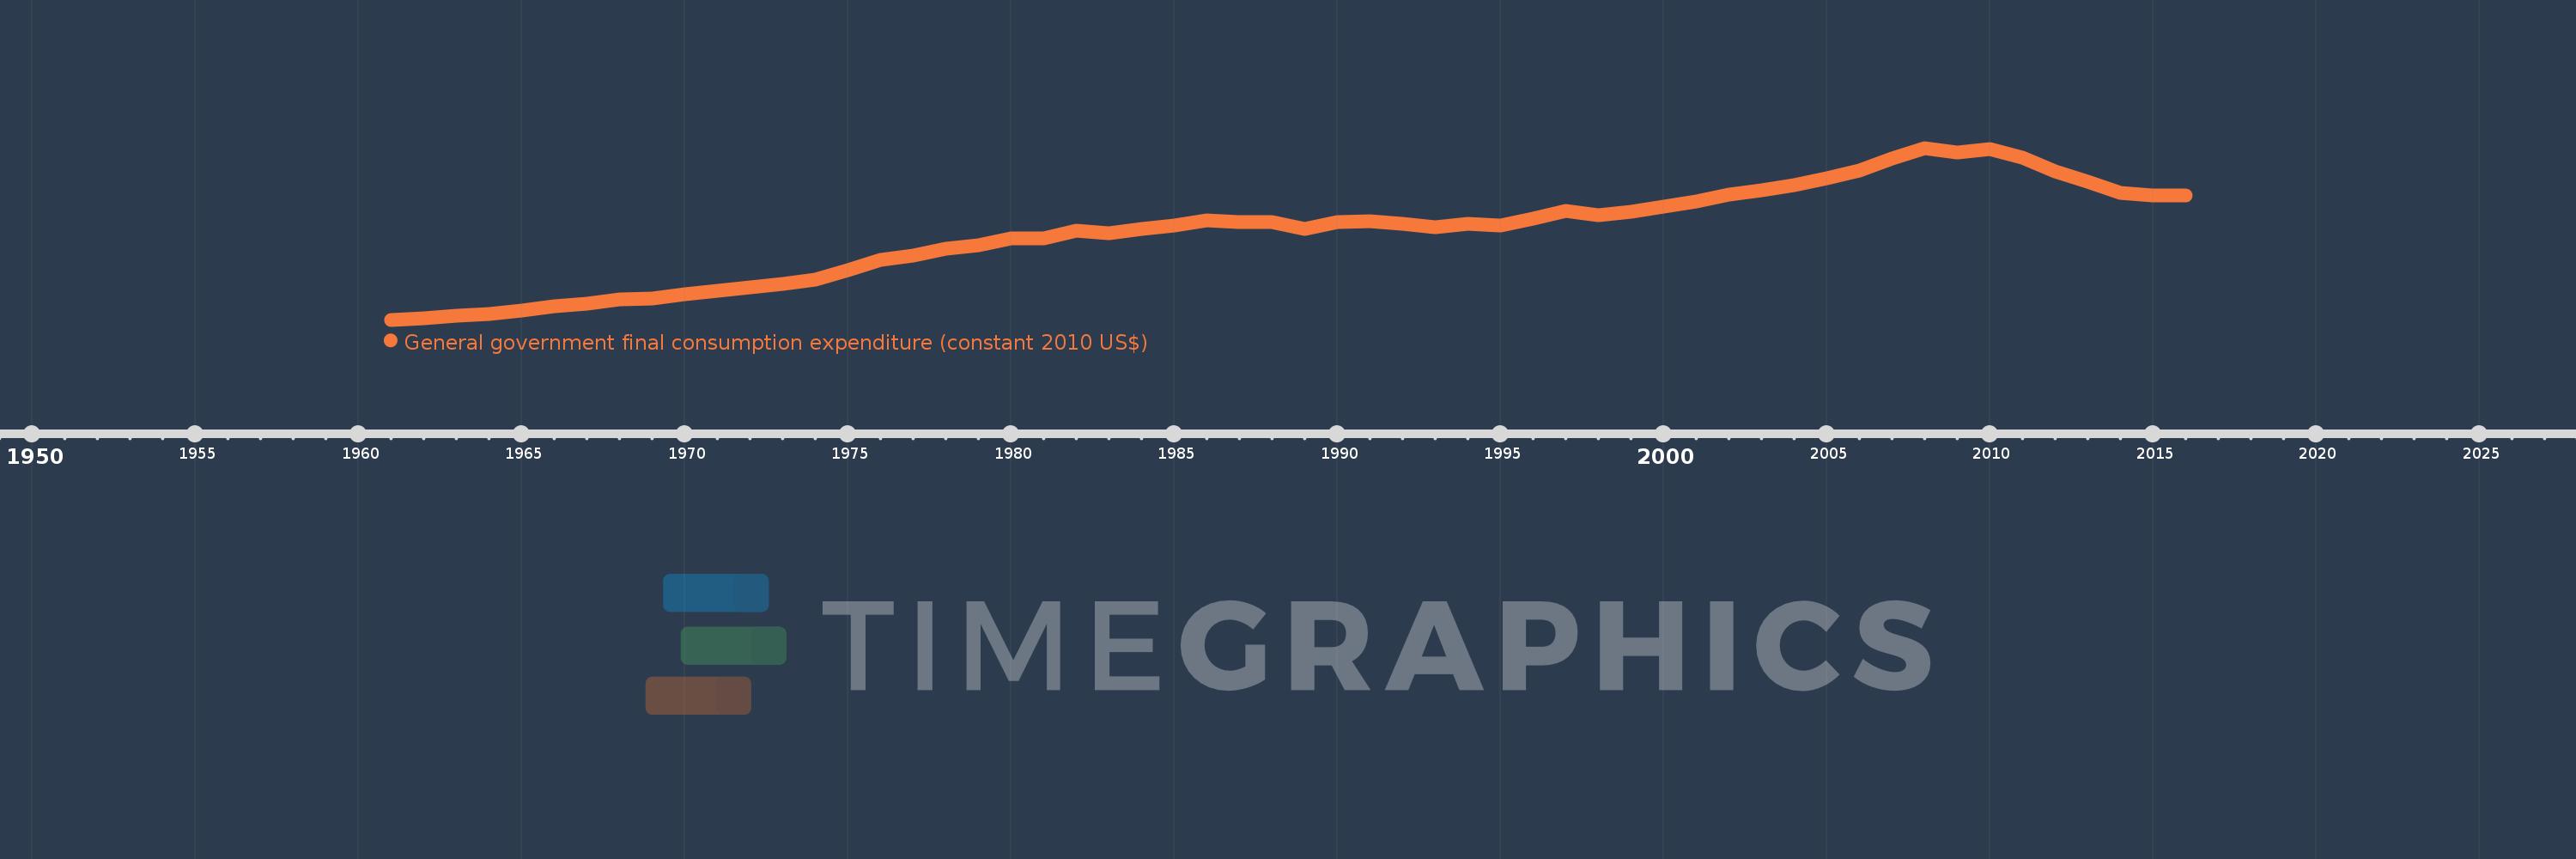
General government final consumption expenditure (constant 2010 US$)
2016,2015,2014,2013,2012,2011,2010,2009,2008,2007,2006,2005,2004,2003,2002,2001,2000,1999,1998,1997,1996,1995,1994,1993,1992,1991,1990,1989,1988,1987,1986,1985,1984,1983,1982,1981,1980,1979,1978,1977,1976,1975,1974,1973,1972,1971,1970,1969,1968,1967,1966,1965,1964,1963,1962,1961
This statistics in other country:
AfghanistanAlbaniaAlgeriaAngolaAntigua and BarbudaArab WorldArgentinaArmeniaArubaAustraliaAustriaAzerbaijanBahamas, TheBahrainBangladeshBarbadosBelarusBelgiumBelizeBeninBermudaBhutanBoliviaBosnia and HerzegovinaBotswanaBrazilBrunei DarussalamBulgariaBurkina FasoBurundiCabo VerdeCambodiaCameroonCanadaCaribbean small statesCentral African RepublicCentral Europe and the BalticsChadChileChinaColombiaComorosCongo, Dem. Rep.Congo, Rep.Costa RicaCote d'IvoireCroatiaCubaCyprusCzech RepublicDenmarkDominicaDominican RepublicEarly-demographic dividendEast Asia & PacificEast Asia & Pacific (excluding high income)East Asia & Pacific (IDA & IBRD countries)EcuadorEgypt, Arab Rep.El SalvadorEquatorial GuineaEritreaEstoniaEuro areaEurope & Central AsiaEurope & Central Asia (excluding high income)Europe & Central Asia (IDA & IBRD countries)European UnionFaroe IslandsFinlandFragile and conflict affected situationsFranceGabonGambia, TheGeorgiaGermanyGhanaGreeceGrenadaGuatemalaGuineaGuinea-BissauGuyanaHaitiHeavily indebted poor countries (HIPC)High incomeHondurasHong Kong SAR, ChinaHungaryIBRD onlyIcelandIDA & IBRD totalIDA blendIDA onlyIDA totalIndiaIndonesiaIran, Islamic Rep.IraqIrelandIsraelItalyJamaicaJapanJordanKazakhstanKenyaKorea, Rep.KosovoKuwaitKyrgyz RepublicLao PDRLate-demographic dividendLatin America & Caribbean Latin America & Caribbean (excluding high income)Latin America & the Caribbean (IDA & IBRD countries)LatviaLeast developed countries: UN classificationLebanonLiberiaLithuaniaLow & middle incomeLow incomeLower middle incomeLuxembourgMacao SAR, ChinaMacedonia, FYRMadagascarMalawiMalaysiaMaliMaltaMauritaniaMauritiusMexicoMiddle East & North AfricaMiddle East & North Africa (excluding high income)Middle East & North Africa (IDA & IBRD countries)Middle incomeMoldovaMongoliaMontenegroMoroccoMozambiqueNamibiaNepalNetherlandsNew ZealandNicaraguaNigerNigeriaNorth AmericaNorwayOECD membersOmanOther small statesPakistanPanamaParaguayPeruPhilippinesPolandPortugalPost-demographic dividendPre-demographic dividendPuerto RicoQatarRomaniaRussian FederationRwandaSaudi ArabiaSenegalSerbiaSeychellesSierra LeoneSingaporeSlovak RepublicSloveniaSmall statesSouth AfricaSouth AsiaSouth Asia (IDA & IBRD)South SudanSpainSri LankaSt. Kitts and NevisSt. LuciaSt. Vincent and the GrenadinesSub-Saharan Africa Sub-Saharan Africa (excluding high income)Sub-Saharan Africa (IDA & IBRD countries)SudanSurinameSwazilandSwedenSwitzerlandTajikistanTanzaniaThailandTimor-LesteTogoTongaTrinidad and TobagoTunisiaTurkeyTurkmenistanUgandaUkraineUnited Arab EmiratesUnited KingdomUnited StatesUpper middle incomeUruguayUzbekistanVanuatuVenezuela, RBVietnamWest Bank and GazaWorldYemen, Rep.ZambiaZimbabwe Timeline:
This timeline shows a graph from 1961 to 2016 of Greece. No data until 1960. Number of actual observations by date: 56.
Source name:
World Development Indicators
Source organization:
World Bank national accounts data, and OECD National Accounts data files.
Categories, topics:
Economy & Growth
Last updated:
apr 23, 2017
Indicators value changes by year
Minimum:
11.61 bln
jan 1, 1961
Maximum:
69.613 bln
jan 1, 2008
At the date of observation
Value
Absolute change
Change from previous value
jan 1, 1961
11.61 bln
+11.61 bln
0.0%
jan 1, 1962
12.121 bln
+510.813 mln
4.4%
jan 1, 1963
12.93 bln
+808.68 mln
6.67%
jan 1, 1964
13.47 bln
+539.692 mln
4.17%
jan 1, 1965
14.727 bln
+1.257 bln
9.33%
jan 1, 1966
16.047 bln
+1.32 bln
8.96%
jan 1, 1967
17.052 bln
+1.005 bln
6.26%
jan 1, 1968
18.496 bln
+1.444 bln
8.47%
jan 1, 1969
18.745 bln
+248.701 mln
1.34%
jan 1, 1970
20.182 bln
+1.438 bln
7.67%
jan 1, 1971
21.373 bln
+1.191 bln
5.9%
jan 1, 1972
22.43 bln
+1.056 bln
4.94%
jan 1, 1973
23.701 bln
+1.271 bln
5.67%
jan 1, 1974
25.266 bln
+1.566 bln
6.61%
jan 1, 1975
28.37 bln
+3.103 bln
12.28%
jan 1, 1976
31.755 bln
+3.386 bln
11.94%
jan 1, 1977
33.385 bln
+1.63 bln
5.13%
jan 1, 1978
35.564 bln
+2.179 bln
6.53%
jan 1, 1979
36.81 bln
+1.246 bln
3.5%
jan 1, 1980
38.962 bln
+2.152 bln
5.85%
jan 1, 1981
39.041 bln
+79.248 mln
0.2%
jan 1, 1982
41.703 bln
+2.662 bln
6.82%
jan 1, 1983
40.849 bln
-853.523 mln
-2.05%
jan 1, 1984
42.319 bln
+1.47 bln
3.6%
jan 1, 1985
43.454 bln
+1.135 bln
2.68%
jan 1, 1986
45.121 bln
+1.667 bln
3.84%
jan 1, 1987
44.627 bln
-493.737 mln
-1.09%
jan 1, 1988
44.726 bln
+99.35 mln
0.22%
jan 1, 1989
42.267 bln
-2.46 bln
-5.5%
jan 1, 1990
44.549 bln
+2.282 bln
5.4%
jan 1, 1991
44.816 bln
+267.293 mln
0.6%
jan 1, 1992
44.144 bln
-672.243 mln
-1.5%
jan 1, 1993
42.82 bln
-1.324 bln
-3.0%
jan 1, 1994
43.933 bln
+1.113 bln
2.6%
jan 1, 1995
43.45 bln
-483.262 mln
-1.1%
jan 1, 1996
45.884 bln
+2.434 bln
5.6%
jan 1, 1997
48.301 bln
+2.417 bln
5.27%
jan 1, 1998
46.771 bln
-1.53 bln
-3.17%
jan 1, 1999
47.984 bln
+1.213 bln
2.59%
jan 1, 2000
49.697 bln
+1.713 bln
3.57%
jan 1, 2001
51.503 bln
+1.806 bln
3.63%
jan 1, 2002
53.957 bln
+2.454 bln
4.76%
jan 1, 2003
55.425 bln
+1.468 bln
2.72%
jan 1, 2004
57.081 bln
+1.657 bln
2.99%
jan 1, 2005
59.41 bln
+2.329 bln
4.08%
jan 1, 2006
61.844 bln
+2.434 bln
4.1%
jan 1, 2007
66.05 bln
+4.206 bln
6.8%
jan 1, 2008
69.613 bln
+3.563 bln
5.39%
jan 1, 2009
67.99 bln
-1.623 bln
-2.33%
jan 1, 2010
69.366 bln
+1.376 bln
2.02%
jan 1, 2011
66.475 bln
-2.891 bln
-4.17%
jan 1, 2012
61.808 bln
-4.667 bln
-7.02%
jan 1, 2013
58.099 bln
-3.708 bln
-6.0%
jan 1, 2014
54.352 bln
-3.747 bln
-6.45%
jan 1, 2015
53.601 bln
-750.741 mln
-1.38%
jan 1, 2016
53.623 bln
+21.876 mln
0.04%
Ranking of countries by current statistics by years


Comments: