29
/
en
AIzaSyAYiBZKx7MnpbEhh9jyipgxe19OcubqV5w
April 1, 2024
259598
Tajikistan
TJK
true
2
1
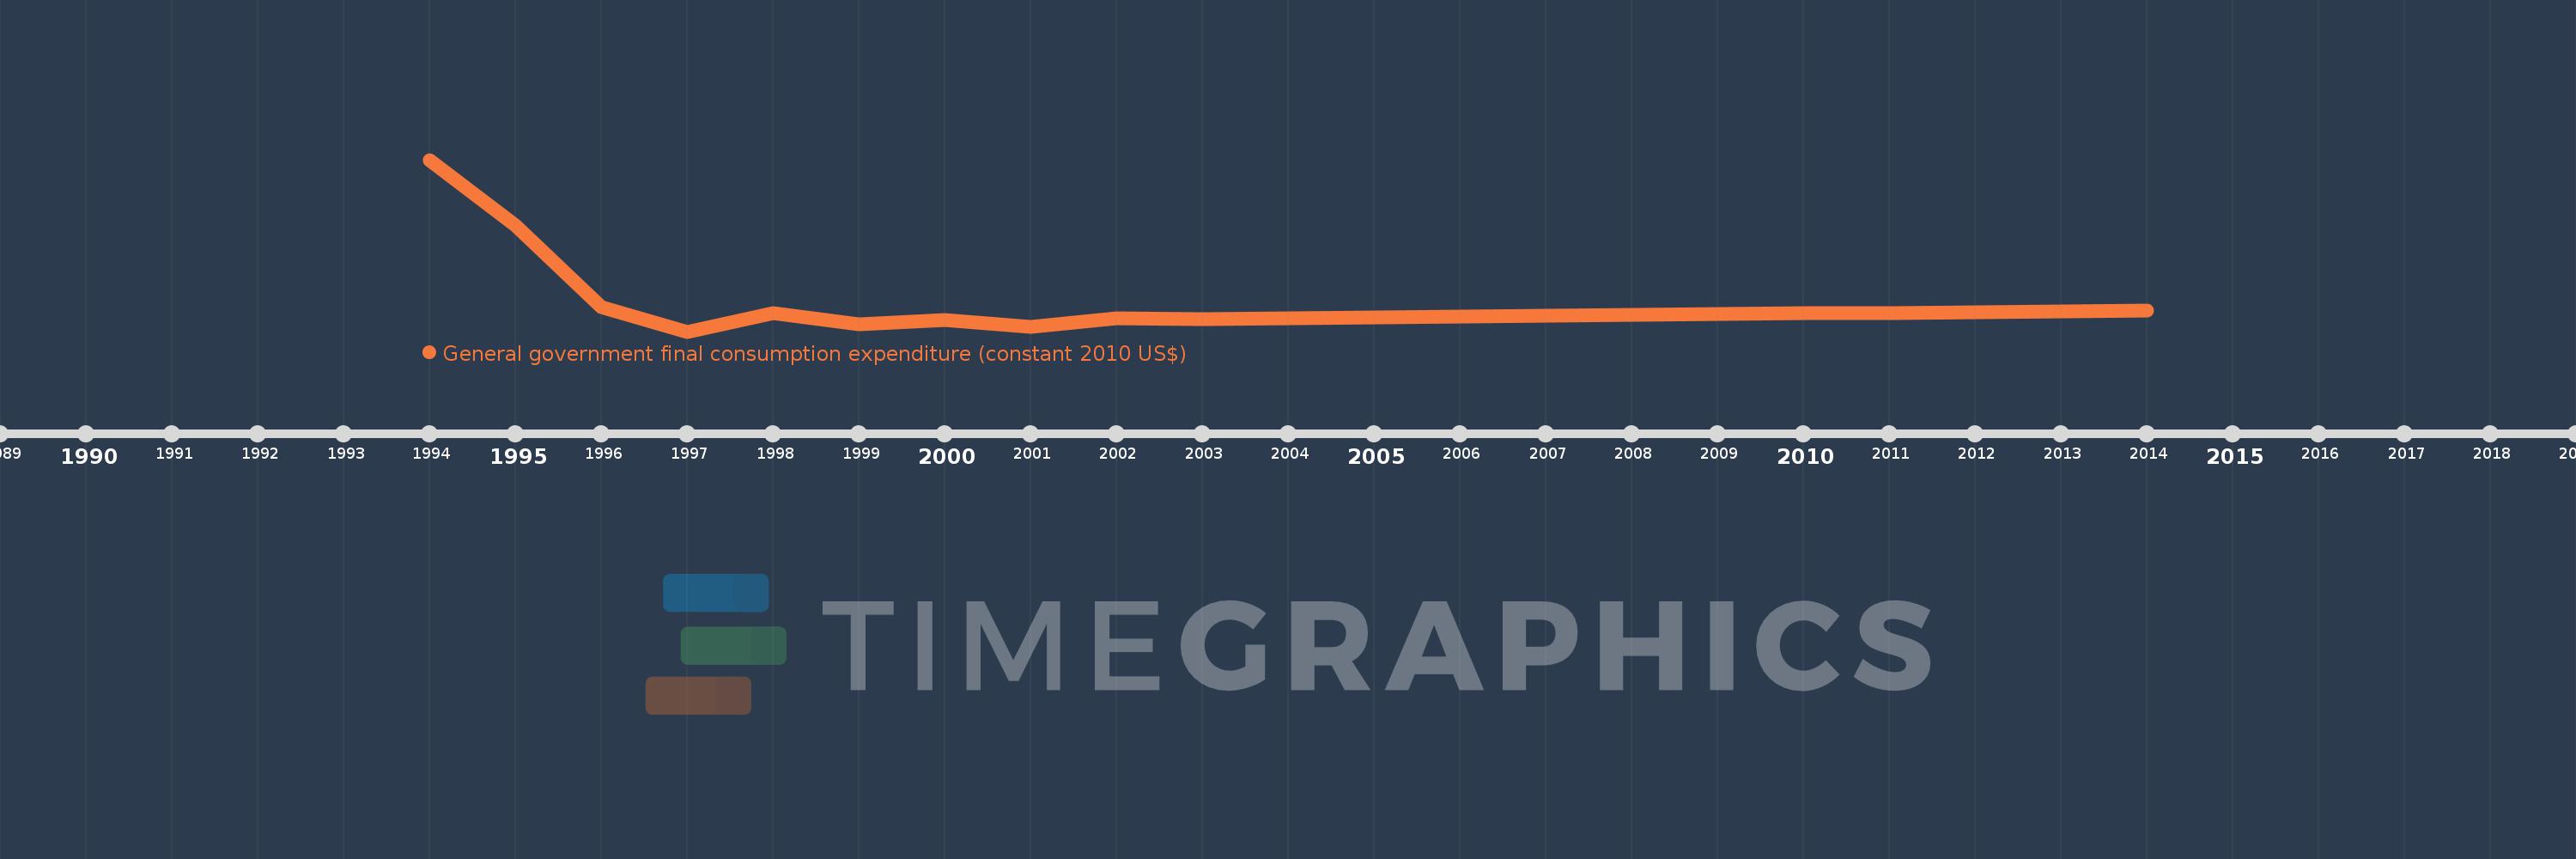
General government final consumption expenditure (constant 2010 US$)
2014,2013,2012,2011,2010,2009,2008,2007,2006,2005,2004,2003,2002,2001,2000,1999,1998,1997,1996,1995,1994
This statistics in other country:
AfghanistanAlbaniaAlgeriaAngolaAntigua and BarbudaArab WorldArgentinaArmeniaArubaAustraliaAustriaAzerbaijanBahamas, TheBahrainBangladeshBarbadosBelarusBelgiumBelizeBeninBermudaBhutanBoliviaBosnia and HerzegovinaBotswanaBrazilBrunei DarussalamBulgariaBurkina FasoBurundiCabo VerdeCambodiaCameroonCanadaCaribbean small statesCentral African RepublicCentral Europe and the BalticsChadChileChinaColombiaComorosCongo, Dem. Rep.Congo, Rep.Costa RicaCote d'IvoireCroatiaCubaCyprusCzech RepublicDenmarkDominicaDominican RepublicEarly-demographic dividendEast Asia & PacificEast Asia & Pacific (excluding high income)East Asia & Pacific (IDA & IBRD countries)EcuadorEgypt, Arab Rep.El SalvadorEquatorial GuineaEritreaEstoniaEuro areaEurope & Central AsiaEurope & Central Asia (excluding high income)Europe & Central Asia (IDA & IBRD countries)European UnionFaroe IslandsFinlandFragile and conflict affected situationsFranceGabonGambia, TheGeorgiaGermanyGhanaGreeceGrenadaGuatemalaGuineaGuinea-BissauGuyanaHaitiHeavily indebted poor countries (HIPC)High incomeHondurasHong Kong SAR, ChinaHungaryIBRD onlyIcelandIDA & IBRD totalIDA blendIDA onlyIDA totalIndiaIndonesiaIran, Islamic Rep.IraqIrelandIsraelItalyJamaicaJapanJordanKazakhstanKenyaKorea, Rep.KosovoKuwaitKyrgyz RepublicLao PDRLate-demographic dividendLatin America & Caribbean Latin America & Caribbean (excluding high income)Latin America & the Caribbean (IDA & IBRD countries)LatviaLeast developed countries: UN classificationLebanonLiberiaLithuaniaLow & middle incomeLow incomeLower middle incomeLuxembourgMacao SAR, ChinaMacedonia, FYRMadagascarMalawiMalaysiaMaliMaltaMauritaniaMauritiusMexicoMiddle East & North AfricaMiddle East & North Africa (excluding high income)Middle East & North Africa (IDA & IBRD countries)Middle incomeMoldovaMongoliaMontenegroMoroccoMozambiqueNamibiaNepalNetherlandsNew ZealandNicaraguaNigerNigeriaNorth AmericaNorwayOECD membersOmanOther small statesPakistanPanamaParaguayPeruPhilippinesPolandPortugalPost-demographic dividendPre-demographic dividendPuerto RicoQatarRomaniaRussian FederationRwandaSaudi ArabiaSenegalSerbiaSeychellesSierra LeoneSingaporeSlovak RepublicSloveniaSmall statesSouth AfricaSouth AsiaSouth Asia (IDA & IBRD)South SudanSpainSri LankaSt. Kitts and NevisSt. LuciaSt. Vincent and the GrenadinesSub-Saharan Africa Sub-Saharan Africa (excluding high income)Sub-Saharan Africa (IDA & IBRD countries)SudanSurinameSwazilandSwedenSwitzerlandTajikistanTanzaniaThailandTimor-LesteTogoTongaTrinidad and TobagoTunisiaTurkeyTurkmenistanUgandaUkraineUnited Arab EmiratesUnited KingdomUnited StatesUpper middle incomeUruguayUzbekistanVanuatuVenezuela, RBVietnamWest Bank and GazaWorldYemen, Rep.ZambiaZimbabwe Timeline:
This timeline shows a graph from 1994 to 2014 of Tajikistan. No data until 1993. Number of actual observations by date: 21.
Source name:
World Development Indicators
Source organization:
World Bank national accounts data, and OECD National Accounts data files.
Categories, topics:
Economy & Growth
Last updated:
apr 23, 2017
Indicators value changes by year
Minimum:
471.159 mln
jan 1, 1997
Maximum:
1.999 bln
jan 1, 1994
At the date of observation
Value
Absolute change
Change from previous value
jan 1, 1994
1.999 bln
+1.999 bln
0.0%
jan 1, 1995
1.413 bln
-585.057 mln
-29.27%
jan 1, 1996
685.272 mln
-728.21 mln
-51.52%
jan 1, 1997
471.159 mln
-214.112 mln
-31.24%
jan 1, 1998
637.665 mln
+166.506 mln
35.34%
jan 1, 1999
534.067 mln
-103.598 mln
-16.25%
jan 1, 2000
577.516 mln
+43.449 mln
8.14%
jan 1, 2001
516.571 mln
-60.945 mln
-10.55%
jan 1, 2002
586.92 mln
+70.35 mln
13.62%
jan 1, 2003
579.88 mln
-7.04 mln
-1.2%
jan 1, 2004
587.279 mln
+7.399 mln
1.28%
jan 1, 2005
594.678 mln
+7.399 mln
1.26%
jan 1, 2006
602.077 mln
+7.399 mln
1.24%
jan 1, 2007
609.477 mln
+7.399 mln
1.23%
jan 1, 2008
616.876 mln
+7.399 mln
1.21%
jan 1, 2009
624.275 mln
+7.399 mln
1.2%
jan 1, 2010
631.674 mln
+7.399 mln
1.19%
jan 1, 2011
639.073 mln
+7.399 mln
1.17%
jan 1, 2012
646.472 mln
+7.399 mln
1.16%
jan 1, 2013
653.871 mln
+7.399 mln
1.14%
jan 1, 2014
661.27 mln
+7.399 mln
1.13%
Ranking of countries by current statistics by years


Comments: