29
/
en
AIzaSyAYiBZKx7MnpbEhh9jyipgxe19OcubqV5w
April 1, 2024
157295
Iran, Islamic Rep.
IRN
true
2
1
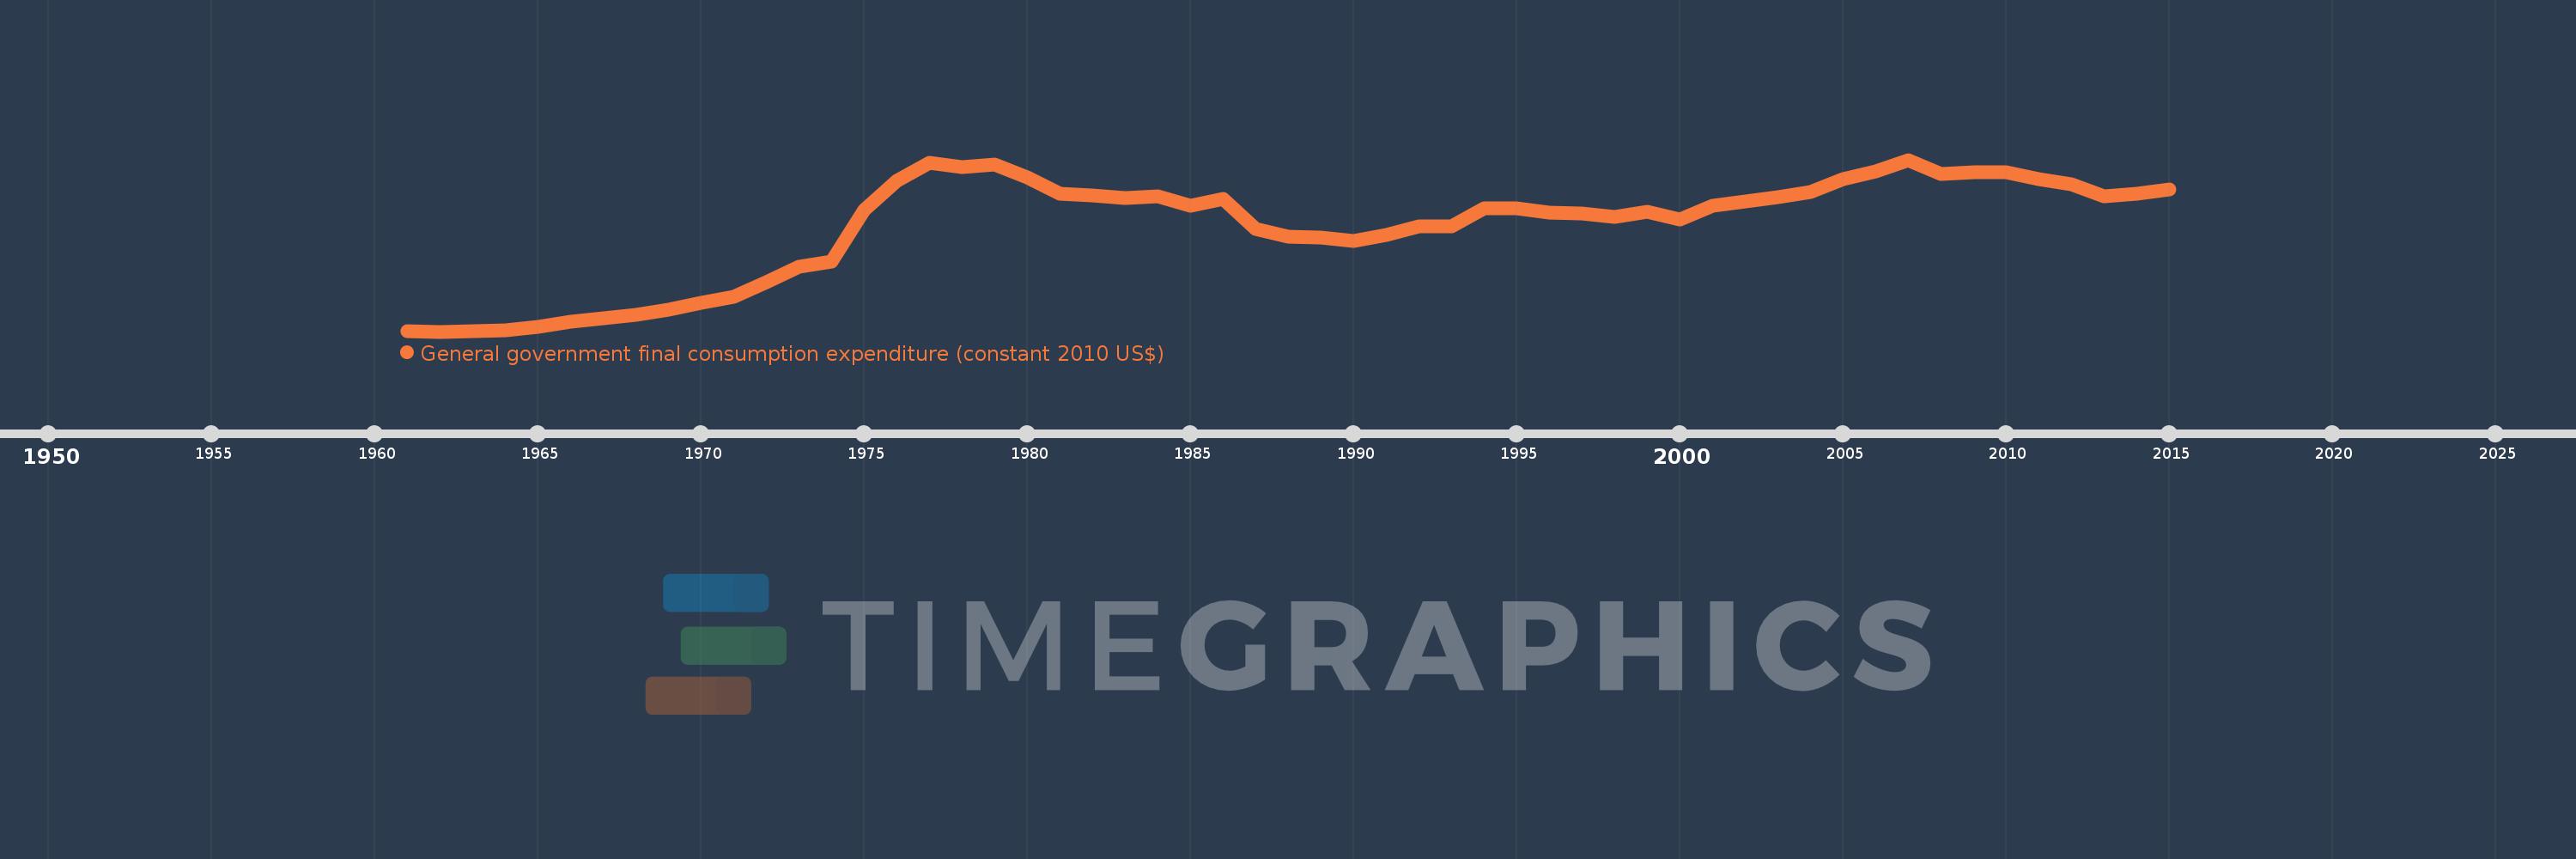
General government final consumption expenditure (constant 2010 US$)
2015,2014,2013,2012,2011,2010,2009,2008,2007,2006,2005,2004,2003,2002,2001,2000,1999,1998,1997,1996,1995,1994,1993,1992,1991,1990,1989,1988,1987,1986,1985,1984,1983,1982,1981,1980,1979,1978,1977,1976,1975,1974,1973,1972,1971,1970,1969,1968,1967,1966,1965,1964,1963,1962,1961
This statistics in other country:
AfghanistanAlbaniaAlgeriaAngolaAntigua and BarbudaArab WorldArgentinaArmeniaArubaAustraliaAustriaAzerbaijanBahamas, TheBahrainBangladeshBarbadosBelarusBelgiumBelizeBeninBermudaBhutanBoliviaBosnia and HerzegovinaBotswanaBrazilBrunei DarussalamBulgariaBurkina FasoBurundiCabo VerdeCambodiaCameroonCanadaCaribbean small statesCentral African RepublicCentral Europe and the BalticsChadChileChinaColombiaComorosCongo, Dem. Rep.Congo, Rep.Costa RicaCote d'IvoireCroatiaCubaCyprusCzech RepublicDenmarkDominicaDominican RepublicEarly-demographic dividendEast Asia & PacificEast Asia & Pacific (excluding high income)East Asia & Pacific (IDA & IBRD countries)EcuadorEgypt, Arab Rep.El SalvadorEquatorial GuineaEritreaEstoniaEuro areaEurope & Central AsiaEurope & Central Asia (excluding high income)Europe & Central Asia (IDA & IBRD countries)European UnionFaroe IslandsFinlandFragile and conflict affected situationsFranceGabonGambia, TheGeorgiaGermanyGhanaGreeceGrenadaGuatemalaGuineaGuinea-BissauGuyanaHaitiHeavily indebted poor countries (HIPC)High incomeHondurasHong Kong SAR, ChinaHungaryIBRD onlyIcelandIDA & IBRD totalIDA blendIDA onlyIDA totalIndiaIndonesiaIran, Islamic Rep.IraqIrelandIsraelItalyJamaicaJapanJordanKazakhstanKenyaKorea, Rep.KosovoKuwaitKyrgyz RepublicLao PDRLate-demographic dividendLatin America & Caribbean Latin America & Caribbean (excluding high income)Latin America & the Caribbean (IDA & IBRD countries)LatviaLeast developed countries: UN classificationLebanonLiberiaLithuaniaLow & middle incomeLow incomeLower middle incomeLuxembourgMacao SAR, ChinaMacedonia, FYRMadagascarMalawiMalaysiaMaliMaltaMauritaniaMauritiusMexicoMiddle East & North AfricaMiddle East & North Africa (excluding high income)Middle East & North Africa (IDA & IBRD countries)Middle incomeMoldovaMongoliaMontenegroMoroccoMozambiqueNamibiaNepalNetherlandsNew ZealandNicaraguaNigerNigeriaNorth AmericaNorwayOECD membersOmanOther small statesPakistanPanamaParaguayPeruPhilippinesPolandPortugalPost-demographic dividendPre-demographic dividendPuerto RicoQatarRomaniaRussian FederationRwandaSaudi ArabiaSenegalSerbiaSeychellesSierra LeoneSingaporeSlovak RepublicSloveniaSmall statesSouth AfricaSouth AsiaSouth Asia (IDA & IBRD)South SudanSpainSri LankaSt. Kitts and NevisSt. LuciaSt. Vincent and the GrenadinesSub-Saharan Africa Sub-Saharan Africa (excluding high income)Sub-Saharan Africa (IDA & IBRD countries)SudanSurinameSwazilandSwedenSwitzerlandTajikistanTanzaniaThailandTimor-LesteTogoTongaTrinidad and TobagoTunisiaTurkeyTurkmenistanUgandaUkraineUnited Arab EmiratesUnited KingdomUnited StatesUpper middle incomeUruguayUzbekistanVanuatuVenezuela, RBVietnamWest Bank and GazaWorldYemen, Rep.ZambiaZimbabwe Timeline:
This timeline shows a graph from 1961 to 2015 of Iran, Islamic Rep.. No data until 1960. Number of actual observations by date: 55.
Source name:
World Development Indicators
Source organization:
World Bank national accounts data, and OECD National Accounts data files.
Categories, topics:
Economy & Growth
Last updated:
apr 23, 2017
Indicators value changes by year
Minimum:
4.318 bln
jan 1, 1962
Maximum:
60.904 bln
jan 1, 2007
At the date of observation
Value
Absolute change
Change from previous value
jan 1, 1961
4.445 bln
+4.445 bln
0.0%
jan 1, 1962
4.318 bln
-126.491 mln
-2.85%
jan 1, 1963
4.46 bln
+141.67 mln
3.28%
jan 1, 1964
4.834 bln
+374.414 mln
8.39%
jan 1, 1965
5.879 bln
+1.045 bln
21.61%
jan 1, 1966
7.708 bln
+1.829 bln
31.11%
jan 1, 1967
8.685 bln
+976.512 mln
12.67%
jan 1, 1968
9.844 bln
+1.159 bln
13.34%
jan 1, 1969
11.614 bln
+1.771 bln
17.99%
jan 1, 1970
13.671 bln
+2.057 bln
17.71%
jan 1, 1971
15.892 bln
+2.221 bln
16.25%
jan 1, 1972
20.54 bln
+4.647 bln
29.24%
jan 1, 1973
25.776 bln
+5.237 bln
25.5%
jan 1, 1974
27.469 bln
+1.692 bln
6.57%
jan 1, 1975
44.434 bln
+16.965 bln
61.76%
jan 1, 1976
54.035 bln
+9.601 bln
21.61%
jan 1, 1977
59.942 bln
+5.907 bln
10.93%
jan 1, 1978
58.366 bln
-1.576 bln
-2.63%
jan 1, 1979
59.372 bln
+1.007 bln
1.73%
jan 1, 1980
55.082 bln
-4.291 bln
-7.23%
jan 1, 1981
49.797 bln
-5.285 bln
-9.59%
jan 1, 1982
49.278 bln
-518.614 mln
-1.04%
jan 1, 1983
48.322 bln
-956.274 mln
-1.94%
jan 1, 1984
48.828 bln
+505.965 mln
1.05%
jan 1, 1985
45.81 bln
-3.018 bln
-6.18%
jan 1, 1986
48.019 bln
+2.209 bln
4.82%
jan 1, 1987
38.14 bln
-9.879 bln
-20.57%
jan 1, 1988
35.488 bln
-2.651 bln
-6.95%
jan 1, 1989
35.319 bln
-169.498 mln
-0.48%
jan 1, 1990
34.291 bln
-1.028 bln
-2.91%
jan 1, 1991
36.093 bln
+1.803 bln
5.26%
jan 1, 1992
39.049 bln
+2.956 bln
8.19%
jan 1, 1993
38.9 bln
-149.913 mln
-0.38%
jan 1, 1994
44.838 bln
+5.939 bln
15.27%
jan 1, 1995
45.012 bln
+173.565 mln
0.39%
jan 1, 1996
43.384 bln
-1.628 bln
-3.62%
jan 1, 1997
43.225 bln
-159.856 mln
-0.37%
jan 1, 1998
42.073 bln
-1.151 bln
-2.66%
jan 1, 1999
43.802 bln
+1.729 bln
4.11%
jan 1, 2000
41.242 bln
-2.561 bln
-5.85%
jan 1, 2001
45.907 bln
+4.665 bln
11.31%
jan 1, 2002
47.122 bln
+1.215 bln
2.65%
jan 1, 2003
48.483 bln
+1.361 bln
2.89%
jan 1, 2004
50.313 bln
+1.83 bln
3.77%
jan 1, 2005
54.584 bln
+4.271 bln
8.49%
jan 1, 2006
57.111 bln
+2.527 bln
4.63%
jan 1, 2007
60.904 bln
+3.793 bln
6.64%
jan 1, 2008
56.209 bln
-4.696 bln
-7.71%
jan 1, 2009
56.72 bln
+511.539 mln
0.91%
jan 1, 2010
56.769 bln
+49.359 mln
0.09%
jan 1, 2011
54.628 bln
-2.141 bln
-3.77%
jan 1, 2012
52.754 bln
-1.874 bln
-3.43%
jan 1, 2013
48.979 bln
-3.774 bln
-7.15%
jan 1, 2014
49.786 bln
+806.841 mln
1.65%
jan 1, 2015
51.136 bln
+1.35 bln
2.71%
Ranking of countries by current statistics by years


Comments: