29
/
en
AIzaSyAYiBZKx7MnpbEhh9jyipgxe19OcubqV5w
April 1, 2024
45095
Low & middle income
LMY
false
2
1
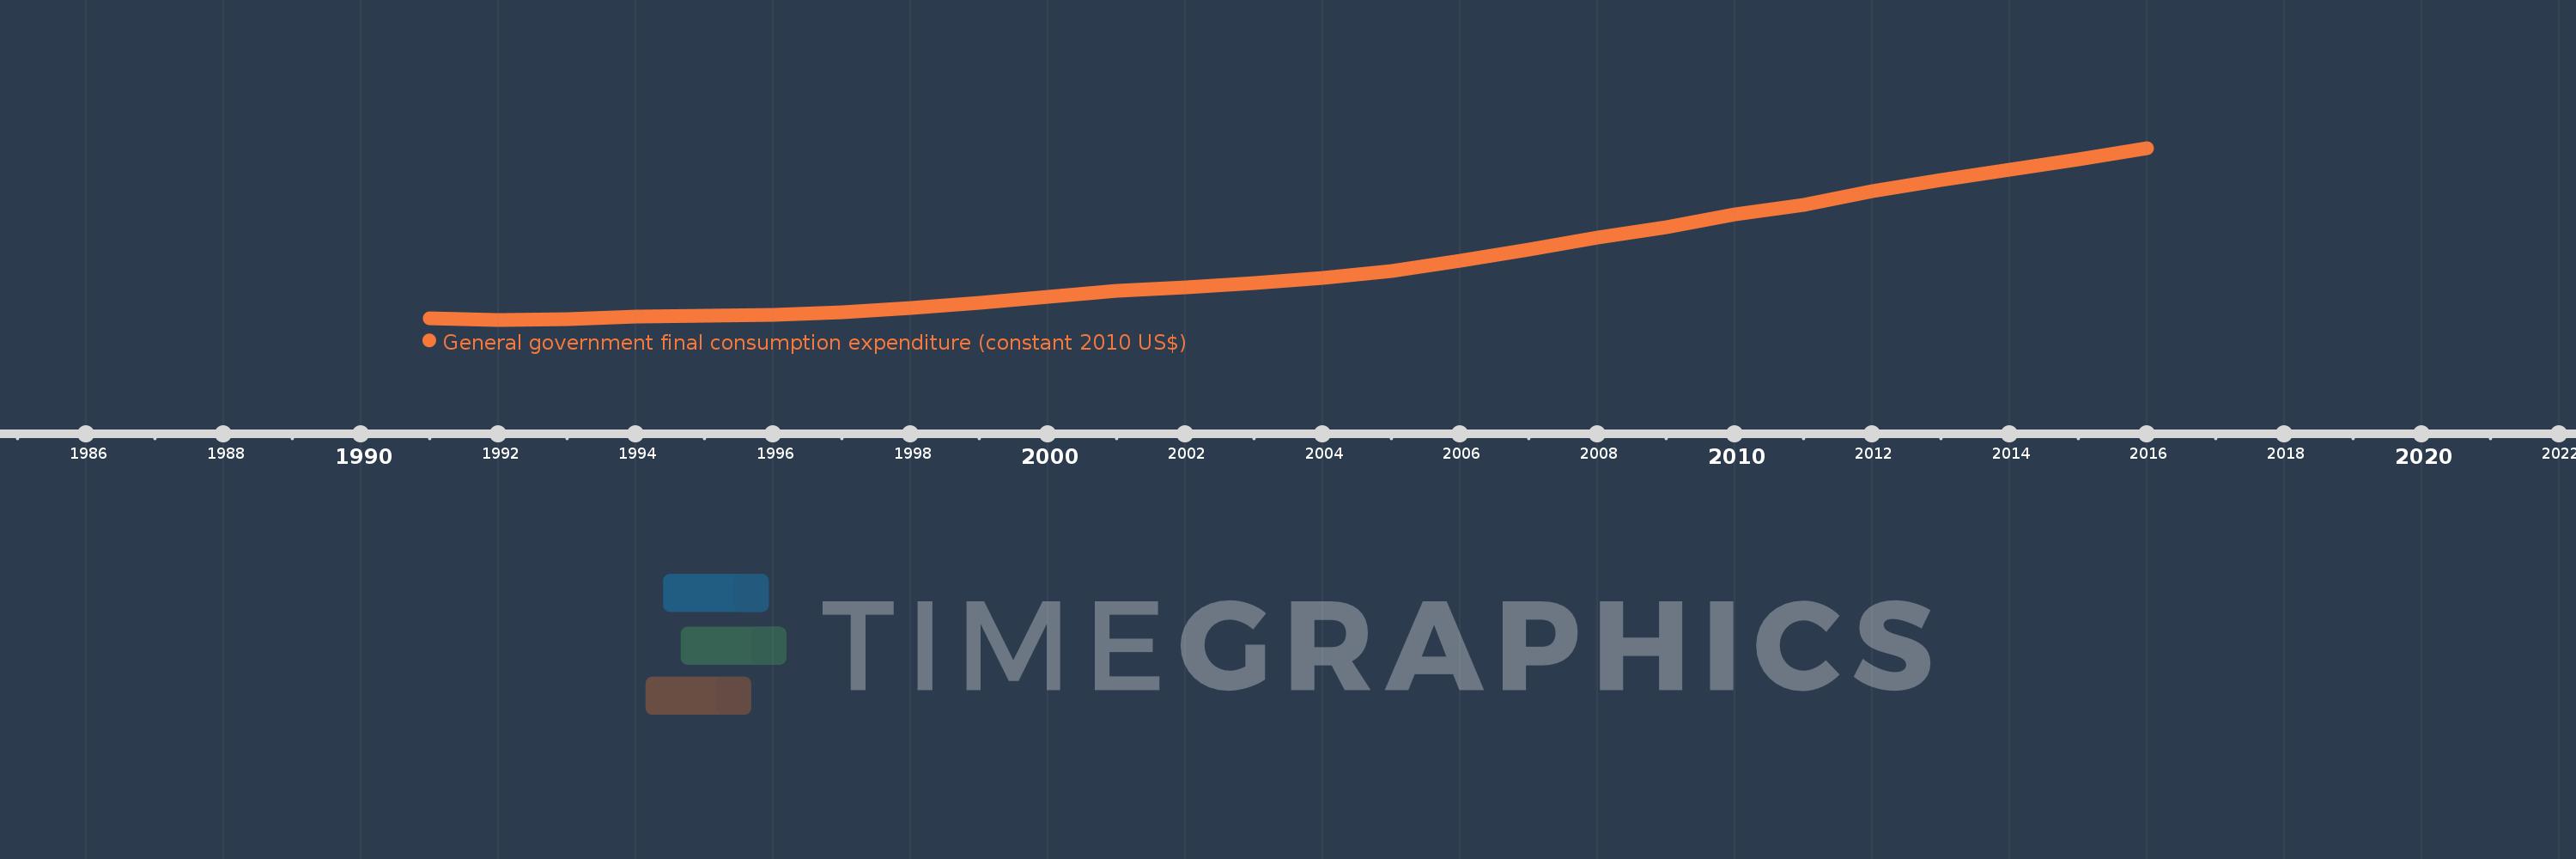
General government final consumption expenditure (constant 2010 US$)
2016,2015,2014,2013,2012,2011,2010,2009,2008,2007,2006,2005,2004,2003,2002,2001,2000,1999,1998,1997,1996,1995,1994,1993,1992,1991
This statistics in other country:
AfghanistanAlbaniaAlgeriaAngolaAntigua and BarbudaArab WorldArgentinaArmeniaArubaAustraliaAustriaAzerbaijanBahamas, TheBahrainBangladeshBarbadosBelarusBelgiumBelizeBeninBermudaBhutanBoliviaBosnia and HerzegovinaBotswanaBrazilBrunei DarussalamBulgariaBurkina FasoBurundiCabo VerdeCambodiaCameroonCanadaCaribbean small statesCentral African RepublicCentral Europe and the BalticsChadChileChinaColombiaComorosCongo, Dem. Rep.Congo, Rep.Costa RicaCote d'IvoireCroatiaCubaCyprusCzech RepublicDenmarkDominicaDominican RepublicEarly-demographic dividendEast Asia & PacificEast Asia & Pacific (excluding high income)East Asia & Pacific (IDA & IBRD countries)EcuadorEgypt, Arab Rep.El SalvadorEquatorial GuineaEritreaEstoniaEuro areaEurope & Central AsiaEurope & Central Asia (excluding high income)Europe & Central Asia (IDA & IBRD countries)European UnionFaroe IslandsFinlandFragile and conflict affected situationsFranceGabonGambia, TheGeorgiaGermanyGhanaGreeceGrenadaGuatemalaGuineaGuinea-BissauGuyanaHaitiHeavily indebted poor countries (HIPC)High incomeHondurasHong Kong SAR, ChinaHungaryIBRD onlyIcelandIDA & IBRD totalIDA blendIDA onlyIDA totalIndiaIndonesiaIran, Islamic Rep.IraqIrelandIsraelItalyJamaicaJapanJordanKazakhstanKenyaKorea, Rep.KosovoKuwaitKyrgyz RepublicLao PDRLate-demographic dividendLatin America & Caribbean Latin America & Caribbean (excluding high income)Latin America & the Caribbean (IDA & IBRD countries)LatviaLeast developed countries: UN classificationLebanonLiberiaLithuaniaLow & middle incomeLow incomeLower middle incomeLuxembourgMacao SAR, ChinaMacedonia, FYRMadagascarMalawiMalaysiaMaliMaltaMauritaniaMauritiusMexicoMiddle East & North AfricaMiddle East & North Africa (excluding high income)Middle East & North Africa (IDA & IBRD countries)Middle incomeMoldovaMongoliaMontenegroMoroccoMozambiqueNamibiaNepalNetherlandsNew ZealandNicaraguaNigerNigeriaNorth AmericaNorwayOECD membersOmanOther small statesPakistanPanamaParaguayPeruPhilippinesPolandPortugalPost-demographic dividendPre-demographic dividendPuerto RicoQatarRomaniaRussian FederationRwandaSaudi ArabiaSenegalSerbiaSeychellesSierra LeoneSingaporeSlovak RepublicSloveniaSmall statesSouth AfricaSouth AsiaSouth Asia (IDA & IBRD)South SudanSpainSri LankaSt. Kitts and NevisSt. LuciaSt. Vincent and the GrenadinesSub-Saharan Africa Sub-Saharan Africa (excluding high income)Sub-Saharan Africa (IDA & IBRD countries)SudanSurinameSwazilandSwedenSwitzerlandTajikistanTanzaniaThailandTimor-LesteTogoTongaTrinidad and TobagoTunisiaTurkeyTurkmenistanUgandaUkraineUnited Arab EmiratesUnited KingdomUnited StatesUpper middle incomeUruguayUzbekistanVanuatuVenezuela, RBVietnamWest Bank and GazaWorldYemen, Rep.ZambiaZimbabwe Timeline:
This timeline shows a graph from 1991 to 2016 of Low & middle income. No data until 1990. Number of actual observations by date: 26.
Source name:
World Development Indicators
Source organization:
World Bank national accounts data, and OECD National Accounts data files.
Categories, topics:
Economy & Growth
Last updated:
apr 23, 2017
Indicators value changes by year
Minimum:
1.362 trl
jan 1, 1992
Maximum:
3.626 trl
jan 1, 2016
At the date of observation
Value
Absolute change
Change from previous value
jan 1, 1991
1.38 trl
+1.38 trl
0.0%
jan 1, 1992
1.362 trl
-18.216 bln
-1.32%
jan 1, 1993
1.367 trl
+4.615 bln
0.34%
jan 1, 1994
1.403 trl
+36.922 bln
2.7%
jan 1, 1995
1.412 trl
+9.014 bln
0.64%
jan 1, 1996
1.43 trl
+18.032 bln
1.28%
jan 1, 1997
1.465 trl
+34.102 bln
2.38%
jan 1, 1998
1.521 trl
+56.454 bln
3.85%
jan 1, 1999
1.583 trl
+62.202 bln
4.09%
jan 1, 2000
1.667 trl
+83.491 bln
5.27%
jan 1, 2001
1.742 trl
+75.32 bln
4.52%
jan 1, 2002
1.787 trl
+44.577 bln
2.56%
jan 1, 2003
1.85 trl
+63.294 bln
3.54%
jan 1, 2004
1.911 trl
+60.663 bln
3.28%
jan 1, 2005
2.009 trl
+98.565 bln
5.16%
jan 1, 2006
2.137 trl
+128.142 bln
6.38%
jan 1, 2007
2.287 trl
+149.793 bln
7.01%
jan 1, 2008
2.444 trl
+157.224 bln
6.87%
jan 1, 2009
2.581 trl
+137.093 bln
5.61%
jan 1, 2010
2.754 trl
+172.659 bln
6.69%
jan 1, 2011
2.879 trl
+125.212 bln
4.55%
jan 1, 2012
3.057 trl
+177.352 bln
6.16%
jan 1, 2013
3.209 trl
+152.653 bln
4.99%
jan 1, 2014
3.342 trl
+132.85 bln
4.14%
jan 1, 2015
3.476 trl
+133.971 bln
4.01%
jan 1, 2016
3.626 trl
+150.044 bln
4.32%
Ranking of countries by current statistics by years


Comments: