29
/
en
AIzaSyAYiBZKx7MnpbEhh9jyipgxe19OcubqV5w
April 1, 2024
37369
IDA & IBRD total
IBT
false
2
1
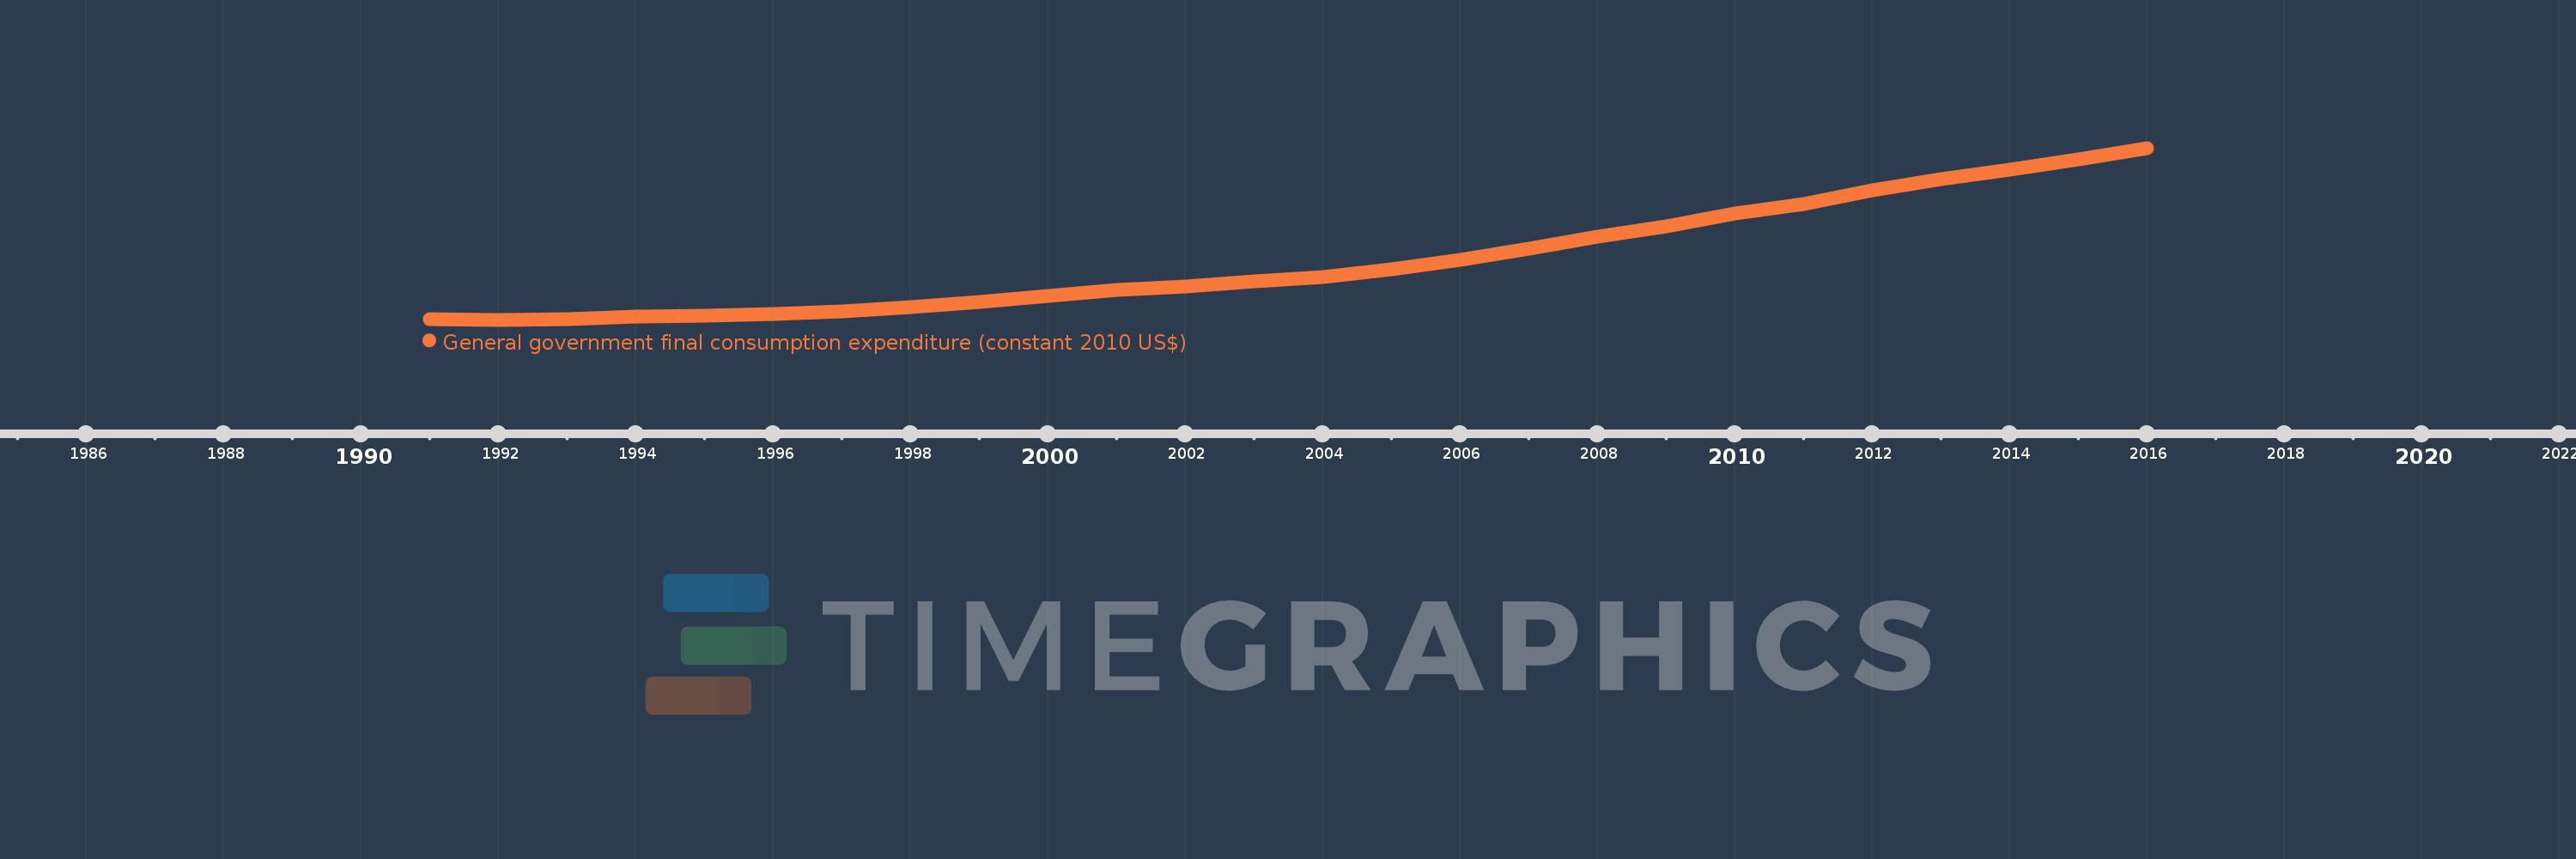
General government final consumption expenditure (constant 2010 US$)
2016,2015,2014,2013,2012,2011,2010,2009,2008,2007,2006,2005,2004,2003,2002,2001,2000,1999,1998,1997,1996,1995,1994,1993,1992,1991
This statistics in other country:
AfghanistanAlbaniaAlgeriaAngolaAntigua and BarbudaArab WorldArgentinaArmeniaArubaAustraliaAustriaAzerbaijanBahamas, TheBahrainBangladeshBarbadosBelarusBelgiumBelizeBeninBermudaBhutanBoliviaBosnia and HerzegovinaBotswanaBrazilBrunei DarussalamBulgariaBurkina FasoBurundiCabo VerdeCambodiaCameroonCanadaCaribbean small statesCentral African RepublicCentral Europe and the BalticsChadChileChinaColombiaComorosCongo, Dem. Rep.Congo, Rep.Costa RicaCote d'IvoireCroatiaCubaCyprusCzech RepublicDenmarkDominicaDominican RepublicEarly-demographic dividendEast Asia & PacificEast Asia & Pacific (excluding high income)East Asia & Pacific (IDA & IBRD countries)EcuadorEgypt, Arab Rep.El SalvadorEquatorial GuineaEritreaEstoniaEuro areaEurope & Central AsiaEurope & Central Asia (excluding high income)Europe & Central Asia (IDA & IBRD countries)European UnionFaroe IslandsFinlandFragile and conflict affected situationsFranceGabonGambia, TheGeorgiaGermanyGhanaGreeceGrenadaGuatemalaGuineaGuinea-BissauGuyanaHaitiHeavily indebted poor countries (HIPC)High incomeHondurasHong Kong SAR, ChinaHungaryIBRD onlyIcelandIDA & IBRD totalIDA blendIDA onlyIDA totalIndiaIndonesiaIran, Islamic Rep.IraqIrelandIsraelItalyJamaicaJapanJordanKazakhstanKenyaKorea, Rep.KosovoKuwaitKyrgyz RepublicLao PDRLate-demographic dividendLatin America & Caribbean Latin America & Caribbean (excluding high income)Latin America & the Caribbean (IDA & IBRD countries)LatviaLeast developed countries: UN classificationLebanonLiberiaLithuaniaLow & middle incomeLow incomeLower middle incomeLuxembourgMacao SAR, ChinaMacedonia, FYRMadagascarMalawiMalaysiaMaliMaltaMauritaniaMauritiusMexicoMiddle East & North AfricaMiddle East & North Africa (excluding high income)Middle East & North Africa (IDA & IBRD countries)Middle incomeMoldovaMongoliaMontenegroMoroccoMozambiqueNamibiaNepalNetherlandsNew ZealandNicaraguaNigerNigeriaNorth AmericaNorwayOECD membersOmanOther small statesPakistanPanamaParaguayPeruPhilippinesPolandPortugalPost-demographic dividendPre-demographic dividendPuerto RicoQatarRomaniaRussian FederationRwandaSaudi ArabiaSenegalSerbiaSeychellesSierra LeoneSingaporeSlovak RepublicSloveniaSmall statesSouth AfricaSouth AsiaSouth Asia (IDA & IBRD)South SudanSpainSri LankaSt. Kitts and NevisSt. LuciaSt. Vincent and the GrenadinesSub-Saharan Africa Sub-Saharan Africa (excluding high income)Sub-Saharan Africa (IDA & IBRD countries)SudanSurinameSwazilandSwedenSwitzerlandTajikistanTanzaniaThailandTimor-LesteTogoTongaTrinidad and TobagoTunisiaTurkeyTurkmenistanUgandaUkraineUnited Arab EmiratesUnited KingdomUnited StatesUpper middle incomeUruguayUzbekistanVanuatuVenezuela, RBVietnamWest Bank and GazaWorldYemen, Rep.ZambiaZimbabwe Timeline:
This timeline shows a graph from 1991 to 2016 of IDA & IBRD total. No data until 1990. Number of actual observations by date: 26.
Source name:
World Development Indicators
Source organization:
World Bank national accounts data, and OECD National Accounts data files.
Categories, topics:
Economy & Growth
Last updated:
apr 23, 2017
Indicators value changes by year
Minimum:
1.422 trl
jan 1, 1992
Maximum:
3.746 trl
jan 1, 2016
At the date of observation
Value
Absolute change
Change from previous value
jan 1, 1991
1.434 trl
+1.434 trl
0.0%
jan 1, 1992
1.422 trl
-11.729 bln
-0.82%
jan 1, 1993
1.431 trl
+9.056 bln
0.64%
jan 1, 1994
1.47 trl
+39.051 bln
2.73%
jan 1, 1995
1.481 trl
+10.464 bln
0.71%
jan 1, 1996
1.502 trl
+21.263 bln
1.44%
jan 1, 1997
1.537 trl
+35.314 bln
2.35%
jan 1, 1998
1.596 trl
+58.742 bln
3.82%
jan 1, 1999
1.66 trl
+63.821 bln
4.0%
jan 1, 2000
1.745 trl
+85.157 bln
5.13%
jan 1, 2001
1.825 trl
+79.653 bln
4.56%
jan 1, 2002
1.871 trl
+46.392 bln
2.54%
jan 1, 2003
1.936 trl
+65.161 bln
3.48%
jan 1, 2004
1.999 trl
+62.734 bln
3.24%
jan 1, 2005
2.1 trl
+101.011 bln
5.05%
jan 1, 2006
2.231 trl
+130.45 bln
6.21%
jan 1, 2007
2.385 trl
+154.334 bln
6.92%
jan 1, 2008
2.545 trl
+160.133 bln
6.71%
jan 1, 2009
2.686 trl
+140.678 bln
5.53%
jan 1, 2010
2.863 trl
+177.246 bln
6.6%
jan 1, 2011
2.991 trl
+128.389 bln
4.48%
jan 1, 2012
3.168 trl
+176.296 bln
5.89%
jan 1, 2013
3.319 trl
+151.692 bln
4.79%
jan 1, 2014
3.455 trl
+136.163 bln
4.1%
jan 1, 2015
3.593 trl
+137.982 bln
3.99%
jan 1, 2016
3.746 trl
+152.787 bln
4.25%
Ranking of countries by current statistics by years


Comments: