29
/
en
AIzaSyAYiBZKx7MnpbEhh9jyipgxe19OcubqV5w
April 1, 2024
277684
Uruguay
URY
true
2
1
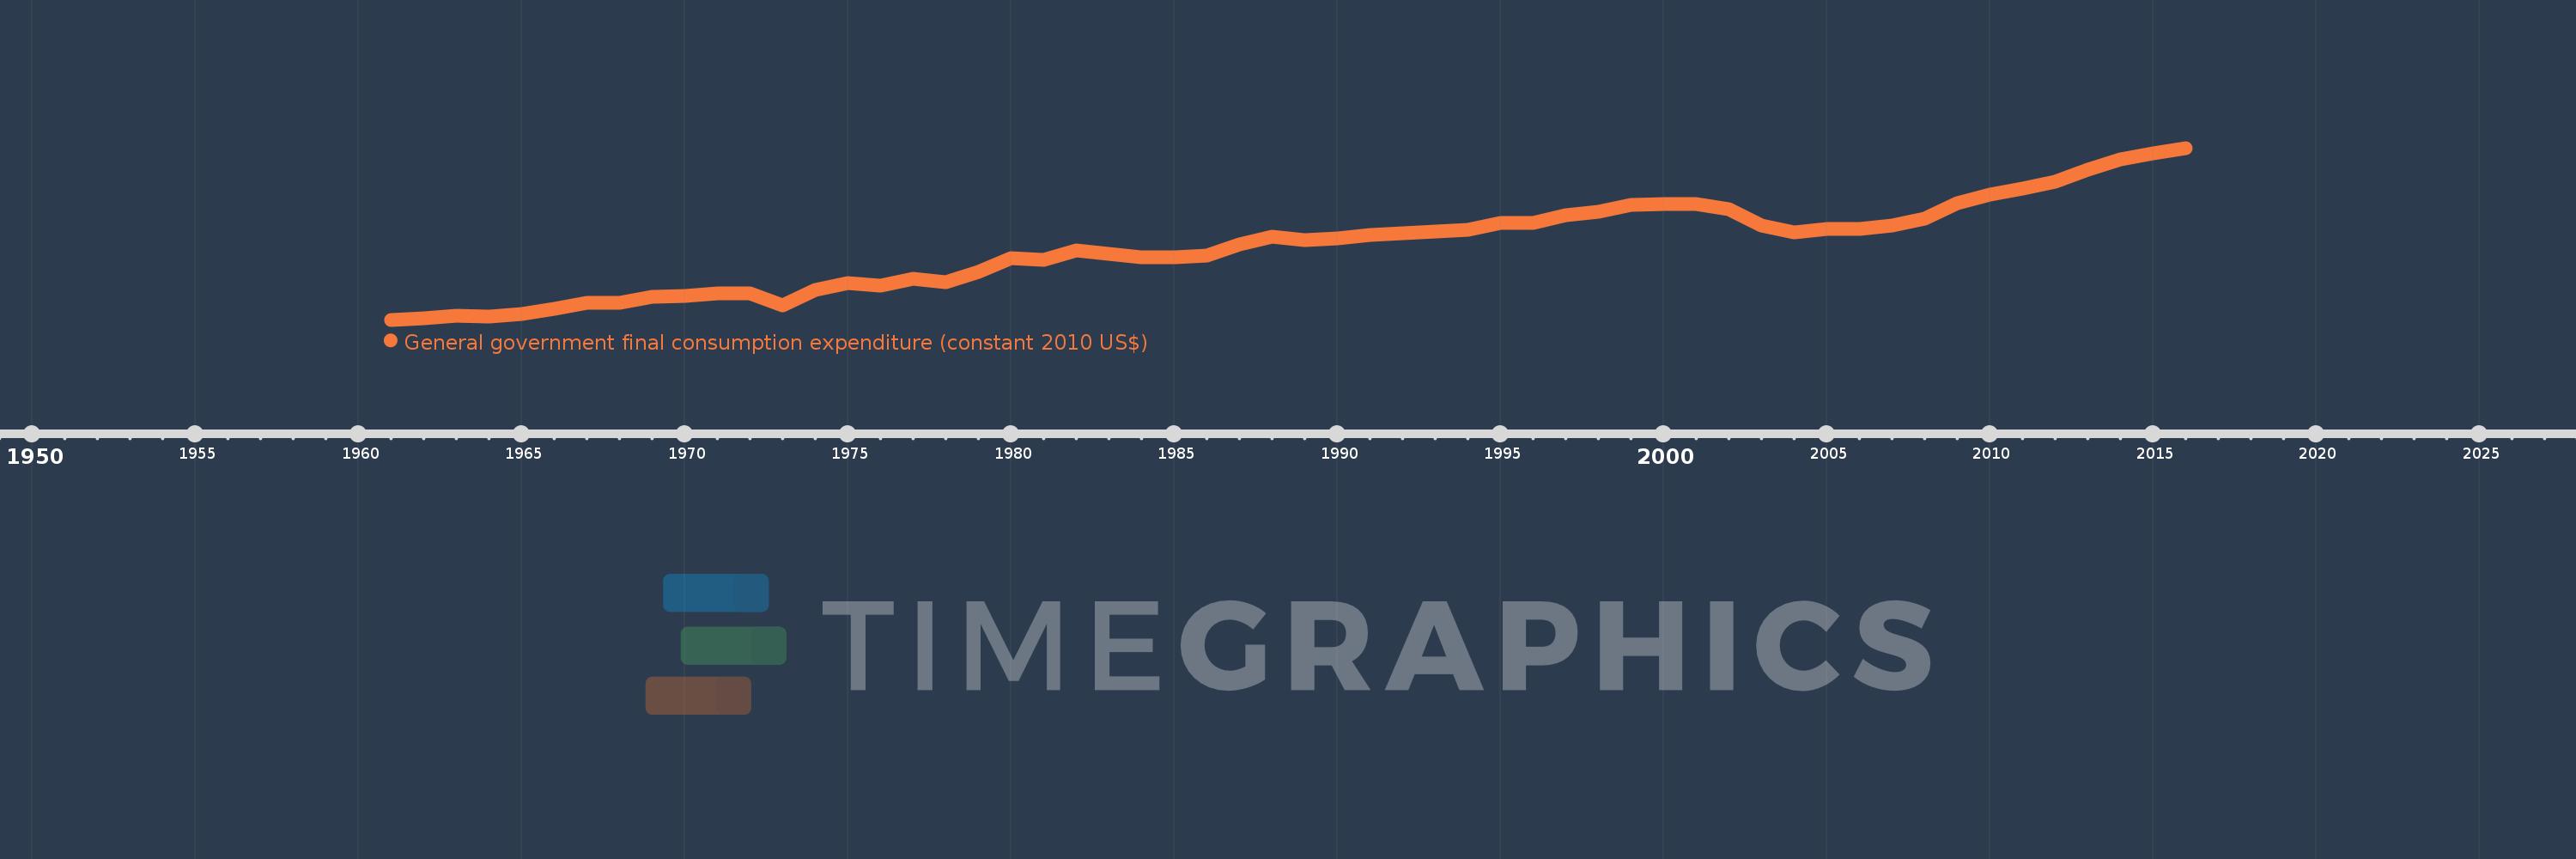
General government final consumption expenditure (constant 2010 US$)
2016,2015,2014,2013,2012,2011,2010,2009,2008,2007,2006,2005,2004,2003,2002,2001,2000,1999,1998,1997,1996,1995,1994,1993,1992,1991,1990,1989,1988,1987,1986,1985,1984,1983,1982,1981,1980,1979,1978,1977,1976,1975,1974,1973,1972,1971,1970,1969,1968,1967,1966,1965,1964,1963,1962,1961
This statistics in other country:
AfghanistanAlbaniaAlgeriaAngolaAntigua and BarbudaArab WorldArgentinaArmeniaArubaAustraliaAustriaAzerbaijanBahamas, TheBahrainBangladeshBarbadosBelarusBelgiumBelizeBeninBermudaBhutanBoliviaBosnia and HerzegovinaBotswanaBrazilBrunei DarussalamBulgariaBurkina FasoBurundiCabo VerdeCambodiaCameroonCanadaCaribbean small statesCentral African RepublicCentral Europe and the BalticsChadChileChinaColombiaComorosCongo, Dem. Rep.Congo, Rep.Costa RicaCote d'IvoireCroatiaCubaCyprusCzech RepublicDenmarkDominicaDominican RepublicEarly-demographic dividendEast Asia & PacificEast Asia & Pacific (excluding high income)East Asia & Pacific (IDA & IBRD countries)EcuadorEgypt, Arab Rep.El SalvadorEquatorial GuineaEritreaEstoniaEuro areaEurope & Central AsiaEurope & Central Asia (excluding high income)Europe & Central Asia (IDA & IBRD countries)European UnionFaroe IslandsFinlandFragile and conflict affected situationsFranceGabonGambia, TheGeorgiaGermanyGhanaGreeceGrenadaGuatemalaGuineaGuinea-BissauGuyanaHaitiHeavily indebted poor countries (HIPC)High incomeHondurasHong Kong SAR, ChinaHungaryIBRD onlyIcelandIDA & IBRD totalIDA blendIDA onlyIDA totalIndiaIndonesiaIran, Islamic Rep.IraqIrelandIsraelItalyJamaicaJapanJordanKazakhstanKenyaKorea, Rep.KosovoKuwaitKyrgyz RepublicLao PDRLate-demographic dividendLatin America & Caribbean Latin America & Caribbean (excluding high income)Latin America & the Caribbean (IDA & IBRD countries)LatviaLeast developed countries: UN classificationLebanonLiberiaLithuaniaLow & middle incomeLow incomeLower middle incomeLuxembourgMacao SAR, ChinaMacedonia, FYRMadagascarMalawiMalaysiaMaliMaltaMauritaniaMauritiusMexicoMiddle East & North AfricaMiddle East & North Africa (excluding high income)Middle East & North Africa (IDA & IBRD countries)Middle incomeMoldovaMongoliaMontenegroMoroccoMozambiqueNamibiaNepalNetherlandsNew ZealandNicaraguaNigerNigeriaNorth AmericaNorwayOECD membersOmanOther small statesPakistanPanamaParaguayPeruPhilippinesPolandPortugalPost-demographic dividendPre-demographic dividendPuerto RicoQatarRomaniaRussian FederationRwandaSaudi ArabiaSenegalSerbiaSeychellesSierra LeoneSingaporeSlovak RepublicSloveniaSmall statesSouth AfricaSouth AsiaSouth Asia (IDA & IBRD)South SudanSpainSri LankaSt. Kitts and NevisSt. LuciaSt. Vincent and the GrenadinesSub-Saharan Africa Sub-Saharan Africa (excluding high income)Sub-Saharan Africa (IDA & IBRD countries)SudanSurinameSwazilandSwedenSwitzerlandTajikistanTanzaniaThailandTimor-LesteTogoTongaTrinidad and TobagoTunisiaTurkeyTurkmenistanUgandaUkraineUnited Arab EmiratesUnited KingdomUnited StatesUpper middle incomeUruguayUzbekistanVanuatuVenezuela, RBVietnamWest Bank and GazaWorldYemen, Rep.ZambiaZimbabwe Timeline:
This timeline shows a graph from 1961 to 2016 of Uruguay. No data until 1960. Number of actual observations by date: 56.
Source name:
World Development Indicators
Source organization:
World Bank national accounts data, and OECD National Accounts data files.
Categories, topics:
Economy & Growth
Last updated:
apr 23, 2017
Indicators value changes by year
Minimum:
1.61 bln
jan 1, 1961
Maximum:
6.172 bln
jan 1, 2016
At the date of observation
Value
Absolute change
Change from previous value
jan 1, 1961
1.61 bln
+1.61 bln
0.0%
jan 1, 1962
1.64 bln
+30.372 mln
1.89%
jan 1, 1963
1.717 bln
+76.678 mln
4.68%
jan 1, 1964
1.695 bln
-21.264 mln
-1.24%
jan 1, 1965
1.761 bln
+65.29 mln
3.85%
jan 1, 1966
1.896 bln
+135.153 mln
7.68%
jan 1, 1967
2.065 bln
+169.303 mln
8.93%
jan 1, 1968
2.058 bln
-6.84 mln
-0.33%
jan 1, 1969
2.23 bln
+171.584 mln
8.34%
jan 1, 1970
2.233 bln
+3.036 mln
0.14%
jan 1, 1971
2.313 bln
+80.482 mln
3.6%
jan 1, 1972
2.317 bln
+3.33 mln
0.14%
jan 1, 1973
1.983 bln
-333.867 mln
-14.41%
jan 1, 1974
2.408 bln
+425.263 mln
21.45%
jan 1, 1975
2.582 bln
+173.736 mln
7.21%
jan 1, 1976
2.518 bln
-63.458 mln
-2.46%
jan 1, 1977
2.708 bln
+189.594 mln
7.53%
jan 1, 1978
2.617 bln
-90.64 mln
-3.35%
jan 1, 1979
2.886 bln
+268.91 mln
10.27%
jan 1, 1980
3.25 bln
+363.329 mln
12.59%
jan 1, 1981
3.206 bln
-43.821 mln
-1.35%
jan 1, 1982
3.446 bln
+240.204 mln
7.49%
jan 1, 1983
3.363 bln
-83.083 mln
-2.41%
jan 1, 1984
3.265 bln
-98.198 mln
-2.92%
jan 1, 1985
3.259 bln
-5.508 mln
-0.17%
jan 1, 1986
3.314 bln
+55.337 mln
1.7%
jan 1, 1987
3.611 bln
+296.54 mln
8.95%
jan 1, 1988
3.806 bln
+194.577 mln
5.39%
jan 1, 1989
3.719 bln
-86.464 mln
-2.27%
jan 1, 1990
3.778 bln
+58.796 mln
1.58%
jan 1, 1991
3.852 bln
+74.295 mln
1.97%
jan 1, 1992
3.896 bln
+43.552 mln
1.13%
jan 1, 1993
3.955 bln
+59.436 mln
1.53%
jan 1, 1994
3.992 bln
+36.635 mln
0.93%
jan 1, 1995
4.171 bln
+179.59 mln
4.5%
jan 1, 1996
4.179 bln
+7.814 mln
0.19%
jan 1, 1997
4.389 bln
+209.692 mln
5.02%
jan 1, 1998
4.488 bln
+98.761 mln
2.25%
jan 1, 1999
4.666 bln
+178.052 mln
3.97%
jan 1, 2000
4.693 bln
+27.156 mln
0.58%
jan 1, 2001
4.679 bln
-13.45 mln
-0.29%
jan 1, 2002
4.546 bln
-133.86 mln
-2.86%
jan 1, 2003
4.121 bln
-424.636 mln
-9.34%
jan 1, 2004
3.923 bln
-197.779 mln
-4.8%
jan 1, 2005
4.022 bln
+99.146 mln
2.53%
jan 1, 2006
4.024 bln
+1.793 mln
0.04%
jan 1, 2007
4.108 bln
+83.495 mln
2.07%
jan 1, 2008
4.299 bln
+191.156 mln
4.65%
jan 1, 2009
4.699 bln
+399.782 mln
9.3%
jan 1, 2010
4.941 bln
+242.255 mln
5.16%
jan 1, 2011
5.094 bln
+153.559 mln
3.11%
jan 1, 2012
5.281 bln
+186.467 mln
3.66%
jan 1, 2013
5.596 bln
+314.888 mln
5.96%
jan 1, 2014
5.871 bln
+275.471 mln
4.92%
jan 1, 2015
6.017 bln
+145.822 mln
2.48%
jan 1, 2016
6.172 bln
+154.585 mln
2.57%
Ranking of countries by current statistics by years


Comments: