29
/
en
AIzaSyAYiBZKx7MnpbEhh9jyipgxe19OcubqV5w
April 1, 2024
50028
Middle East & North Africa (IDA & IBRD countries)
TMN
false
2
1
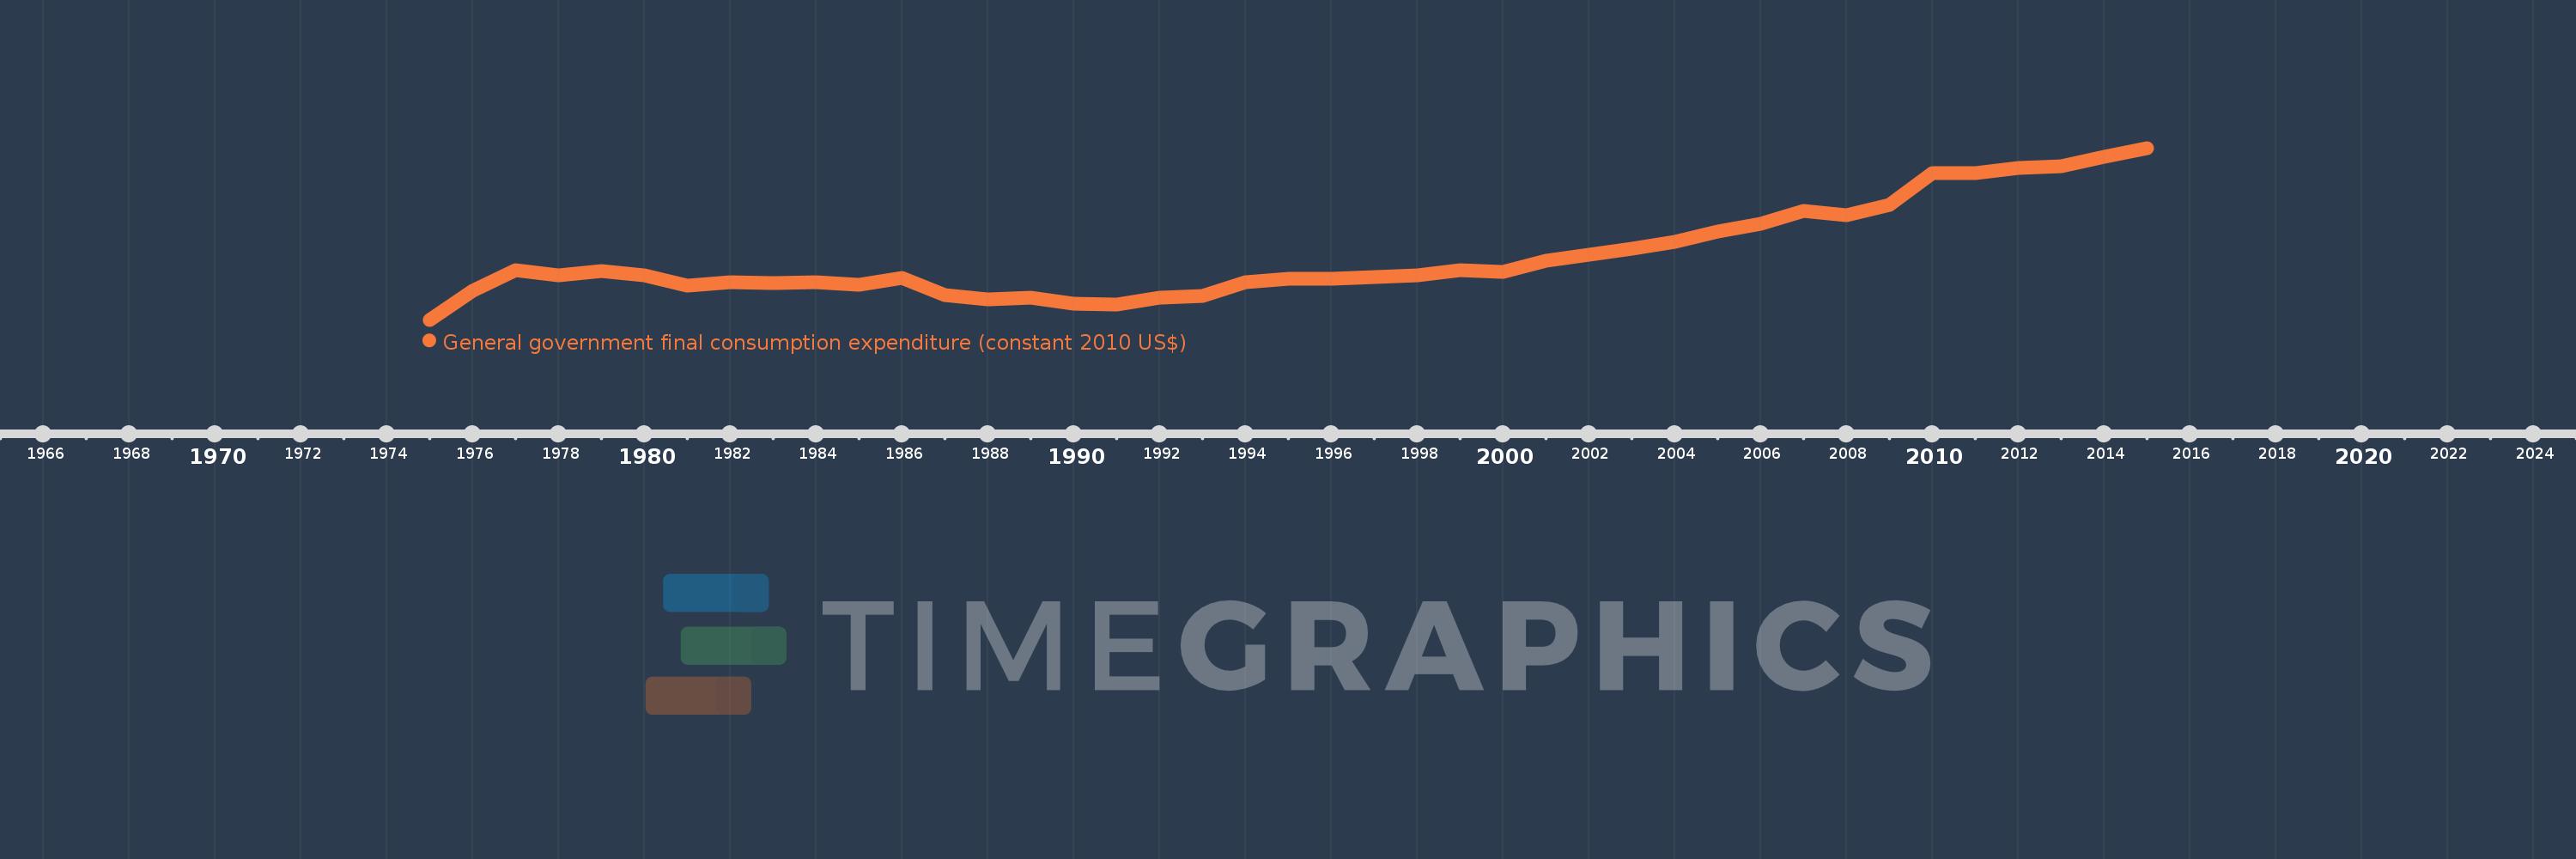
General government final consumption expenditure (constant 2010 US$)
2015,2014,2013,2012,2011,2010,2009,2008,2007,2006,2005,2004,2003,2002,2001,2000,1999,1998,1997,1996,1995,1994,1993,1992,1991,1990,1989,1988,1987,1986,1985,1984,1983,1982,1981,1980,1979,1978,1977,1976,1975
This statistics in other country:
AfghanistanAlbaniaAlgeriaAngolaAntigua and BarbudaArab WorldArgentinaArmeniaArubaAustraliaAustriaAzerbaijanBahamas, TheBahrainBangladeshBarbadosBelarusBelgiumBelizeBeninBermudaBhutanBoliviaBosnia and HerzegovinaBotswanaBrazilBrunei DarussalamBulgariaBurkina FasoBurundiCabo VerdeCambodiaCameroonCanadaCaribbean small statesCentral African RepublicCentral Europe and the BalticsChadChileChinaColombiaComorosCongo, Dem. Rep.Congo, Rep.Costa RicaCote d'IvoireCroatiaCubaCyprusCzech RepublicDenmarkDominicaDominican RepublicEarly-demographic dividendEast Asia & PacificEast Asia & Pacific (excluding high income)East Asia & Pacific (IDA & IBRD countries)EcuadorEgypt, Arab Rep.El SalvadorEquatorial GuineaEritreaEstoniaEuro areaEurope & Central AsiaEurope & Central Asia (excluding high income)Europe & Central Asia (IDA & IBRD countries)European UnionFaroe IslandsFinlandFragile and conflict affected situationsFranceGabonGambia, TheGeorgiaGermanyGhanaGreeceGrenadaGuatemalaGuineaGuinea-BissauGuyanaHaitiHeavily indebted poor countries (HIPC)High incomeHondurasHong Kong SAR, ChinaHungaryIBRD onlyIcelandIDA & IBRD totalIDA blendIDA onlyIDA totalIndiaIndonesiaIran, Islamic Rep.IraqIrelandIsraelItalyJamaicaJapanJordanKazakhstanKenyaKorea, Rep.KosovoKuwaitKyrgyz RepublicLao PDRLate-demographic dividendLatin America & Caribbean Latin America & Caribbean (excluding high income)Latin America & the Caribbean (IDA & IBRD countries)LatviaLeast developed countries: UN classificationLebanonLiberiaLithuaniaLow & middle incomeLow incomeLower middle incomeLuxembourgMacao SAR, ChinaMacedonia, FYRMadagascarMalawiMalaysiaMaliMaltaMauritaniaMauritiusMexicoMiddle East & North AfricaMiddle East & North Africa (excluding high income)Middle East & North Africa (IDA & IBRD countries)Middle incomeMoldovaMongoliaMontenegroMoroccoMozambiqueNamibiaNepalNetherlandsNew ZealandNicaraguaNigerNigeriaNorth AmericaNorwayOECD membersOmanOther small statesPakistanPanamaParaguayPeruPhilippinesPolandPortugalPost-demographic dividendPre-demographic dividendPuerto RicoQatarRomaniaRussian FederationRwandaSaudi ArabiaSenegalSerbiaSeychellesSierra LeoneSingaporeSlovak RepublicSloveniaSmall statesSouth AfricaSouth AsiaSouth Asia (IDA & IBRD)South SudanSpainSri LankaSt. Kitts and NevisSt. LuciaSt. Vincent and the GrenadinesSub-Saharan Africa Sub-Saharan Africa (excluding high income)Sub-Saharan Africa (IDA & IBRD countries)SudanSurinameSwazilandSwedenSwitzerlandTajikistanTanzaniaThailandTimor-LesteTogoTongaTrinidad and TobagoTunisiaTurkeyTurkmenistanUgandaUkraineUnited Arab EmiratesUnited KingdomUnited StatesUpper middle incomeUruguayUzbekistanVanuatuVenezuela, RBVietnamWest Bank and GazaWorldYemen, Rep.ZambiaZimbabwe Timeline:
This timeline shows a graph from 1975 to 2015 of Middle East & North Africa (IDA & IBRD countries). No data until 1974. Number of actual observations by date: 41.
Source name:
World Development Indicators
Source organization:
World Bank national accounts data, and OECD National Accounts data files.
Categories, topics:
Economy & Growth
Last updated:
apr 23, 2017
Indicators value changes by year
Minimum:
86.714 bln
jan 1, 1975
Maximum:
208.133 bln
jan 1, 2015
At the date of observation
Value
Absolute change
Change from previous value
jan 1, 1975
86.714 bln
+86.714 bln
0.0%
jan 1, 1976
107.098 bln
+20.384 bln
23.51%
jan 1, 1977
121.72 bln
+14.622 bln
13.65%
jan 1, 1978
118.069 bln
-3.651 bln
-3.0%
jan 1, 1979
121.409 bln
+3.34 bln
2.83%
jan 1, 1980
118.325 bln
-3.084 bln
-2.54%
jan 1, 1981
110.668 bln
-7.657 bln
-6.47%
jan 1, 1982
113.428 bln
+2.76 bln
2.49%
jan 1, 1983
112.566 bln
-862.599 mln
-0.76%
jan 1, 1984
113.204 bln
+637.953 mln
0.57%
jan 1, 1985
111.61 bln
-1.594 bln
-1.41%
jan 1, 1986
116.467 bln
+4.857 bln
4.35%
jan 1, 1987
103.988 bln
-12.478 bln
-10.71%
jan 1, 1988
101.077 bln
-2.911 bln
-2.8%
jan 1, 1989
102.607 bln
+1.53 bln
1.51%
jan 1, 1990
98.308 bln
-4.299 bln
-4.19%
jan 1, 1991
97.341 bln
-967.572 mln
-0.98%
jan 1, 1992
102.333 bln
+4.992 bln
5.13%
jan 1, 1993
103.469 bln
+1.136 bln
1.11%
jan 1, 1994
113.203 bln
+9.734 bln
9.41%
jan 1, 1995
115.598 bln
+2.395 bln
2.12%
jan 1, 1996
115.528 bln
-69.49 mln
-0.06%
jan 1, 1997
117.029 bln
+1.501 bln
1.3%
jan 1, 1998
118.189 bln
+1.16 bln
0.99%
jan 1, 1999
121.702 bln
+3.513 bln
2.97%
jan 1, 2000
120.411 bln
-1.291 bln
-1.06%
jan 1, 2001
128.512 bln
+8.101 bln
6.73%
jan 1, 2002
132.941 bln
+4.428 bln
3.45%
jan 1, 2003
137.087 bln
+4.147 bln
3.12%
jan 1, 2004
141.689 bln
+4.602 bln
3.36%
jan 1, 2005
149.297 bln
+7.609 bln
5.37%
jan 1, 2006
154.59 bln
+5.293 bln
3.54%
jan 1, 2007
163.515 bln
+8.925 bln
5.77%
jan 1, 2008
160.45 bln
-3.065 bln
-1.87%
jan 1, 2009
167.756 bln
+7.306 bln
4.55%
jan 1, 2010
190.188 bln
+22.432 bln
13.37%
jan 1, 2011
190.431 bln
+243.291 mln
0.13%
jan 1, 2012
194.26 bln
+3.828 bln
2.01%
jan 1, 2013
195.224 bln
+964.052 mln
0.5%
jan 1, 2014
201.887 bln
+6.663 bln
3.41%
jan 1, 2015
208.133 bln
+6.246 bln
3.09%
Ranking of countries by current statistics by years


Comments: