29
/
en
AIzaSyAYiBZKx7MnpbEhh9jyipgxe19OcubqV5w
April 1, 2024
118921
Denmark
DNK
true
2
1
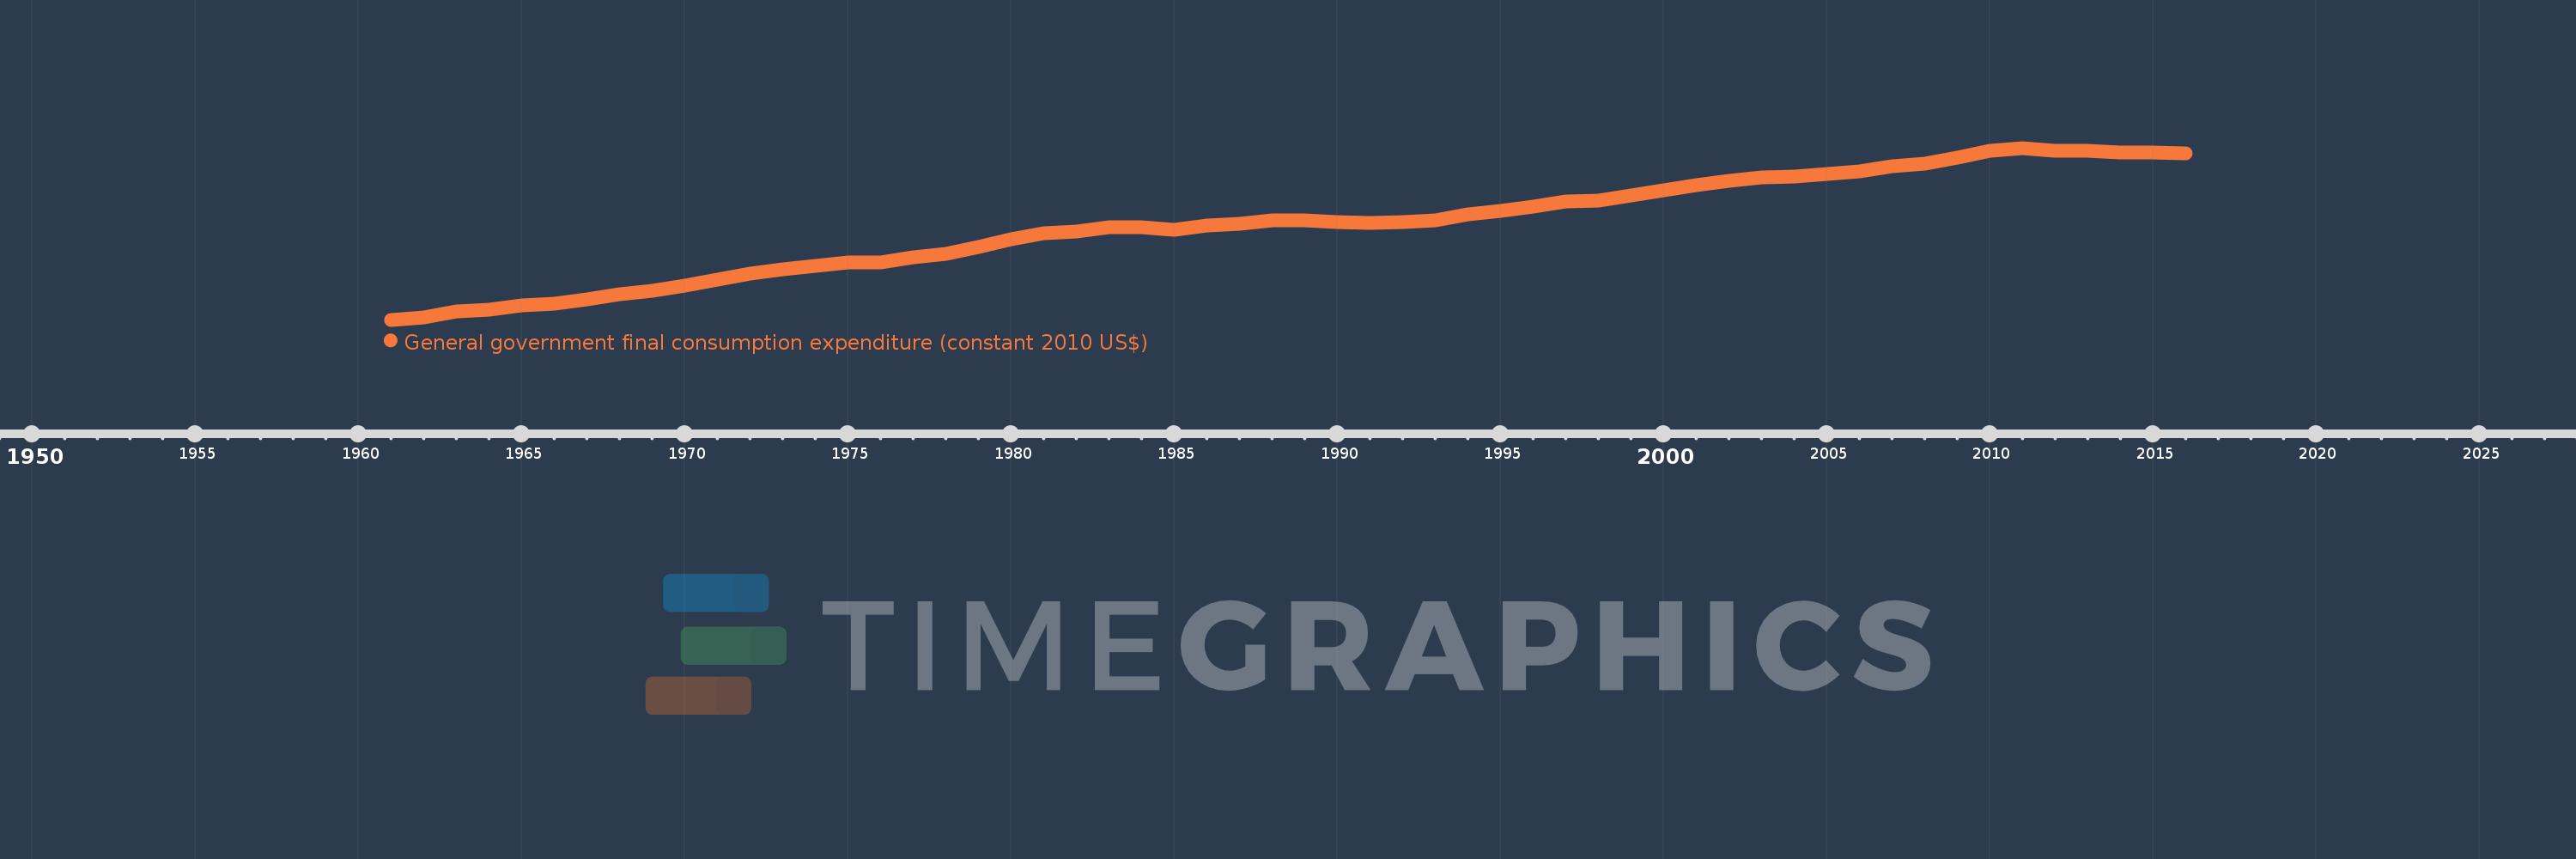
General government final consumption expenditure (constant 2010 US$)
2016,2015,2014,2013,2012,2011,2010,2009,2008,2007,2006,2005,2004,2003,2002,2001,2000,1999,1998,1997,1996,1995,1994,1993,1992,1991,1990,1989,1988,1987,1986,1985,1984,1983,1982,1981,1980,1979,1978,1977,1976,1975,1974,1973,1972,1971,1970,1969,1968,1967,1966,1965,1964,1963,1962,1961
This statistics in other country:
AfghanistanAlbaniaAlgeriaAngolaAntigua and BarbudaArab WorldArgentinaArmeniaArubaAustraliaAustriaAzerbaijanBahamas, TheBahrainBangladeshBarbadosBelarusBelgiumBelizeBeninBermudaBhutanBoliviaBosnia and HerzegovinaBotswanaBrazilBrunei DarussalamBulgariaBurkina FasoBurundiCabo VerdeCambodiaCameroonCanadaCaribbean small statesCentral African RepublicCentral Europe and the BalticsChadChileChinaColombiaComorosCongo, Dem. Rep.Congo, Rep.Costa RicaCote d'IvoireCroatiaCubaCyprusCzech RepublicDenmarkDominicaDominican RepublicEarly-demographic dividendEast Asia & PacificEast Asia & Pacific (excluding high income)East Asia & Pacific (IDA & IBRD countries)EcuadorEgypt, Arab Rep.El SalvadorEquatorial GuineaEritreaEstoniaEuro areaEurope & Central AsiaEurope & Central Asia (excluding high income)Europe & Central Asia (IDA & IBRD countries)European UnionFaroe IslandsFinlandFragile and conflict affected situationsFranceGabonGambia, TheGeorgiaGermanyGhanaGreeceGrenadaGuatemalaGuineaGuinea-BissauGuyanaHaitiHeavily indebted poor countries (HIPC)High incomeHondurasHong Kong SAR, ChinaHungaryIBRD onlyIcelandIDA & IBRD totalIDA blendIDA onlyIDA totalIndiaIndonesiaIran, Islamic Rep.IraqIrelandIsraelItalyJamaicaJapanJordanKazakhstanKenyaKorea, Rep.KosovoKuwaitKyrgyz RepublicLao PDRLate-demographic dividendLatin America & Caribbean Latin America & Caribbean (excluding high income)Latin America & the Caribbean (IDA & IBRD countries)LatviaLeast developed countries: UN classificationLebanonLiberiaLithuaniaLow & middle incomeLow incomeLower middle incomeLuxembourgMacao SAR, ChinaMacedonia, FYRMadagascarMalawiMalaysiaMaliMaltaMauritaniaMauritiusMexicoMiddle East & North AfricaMiddle East & North Africa (excluding high income)Middle East & North Africa (IDA & IBRD countries)Middle incomeMoldovaMongoliaMontenegroMoroccoMozambiqueNamibiaNepalNetherlandsNew ZealandNicaraguaNigerNigeriaNorth AmericaNorwayOECD membersOmanOther small statesPakistanPanamaParaguayPeruPhilippinesPolandPortugalPost-demographic dividendPre-demographic dividendPuerto RicoQatarRomaniaRussian FederationRwandaSaudi ArabiaSenegalSerbiaSeychellesSierra LeoneSingaporeSlovak RepublicSloveniaSmall statesSouth AfricaSouth AsiaSouth Asia (IDA & IBRD)South SudanSpainSri LankaSt. Kitts and NevisSt. LuciaSt. Vincent and the GrenadinesSub-Saharan Africa Sub-Saharan Africa (excluding high income)Sub-Saharan Africa (IDA & IBRD countries)SudanSurinameSwazilandSwedenSwitzerlandTajikistanTanzaniaThailandTimor-LesteTogoTongaTrinidad and TobagoTunisiaTurkeyTurkmenistanUgandaUkraineUnited Arab EmiratesUnited KingdomUnited StatesUpper middle incomeUruguayUzbekistanVanuatuVenezuela, RBVietnamWest Bank and GazaWorldYemen, Rep.ZambiaZimbabwe Timeline:
This timeline shows a graph from 1961 to 2016 of Denmark. No data until 1960. Number of actual observations by date: 56.
Source name:
World Development Indicators
Source organization:
World Bank national accounts data, and OECD National Accounts data files.
Categories, topics:
Economy & Growth
Last updated:
apr 23, 2017
Indicators value changes by year
Minimum:
20.026 bln
jan 1, 1961
Maximum:
88.116 bln
jan 1, 2011
At the date of observation
Value
Absolute change
Change from previous value
jan 1, 1961
20.026 bln
+20.026 bln
0.0%
jan 1, 1962
21.078 bln
+1.052 bln
5.25%
jan 1, 1963
23.171 bln
+2.094 bln
9.93%
jan 1, 1964
23.841 bln
+669.685 mln
2.89%
jan 1, 1965
25.572 bln
+1.731 bln
7.26%
jan 1, 1966
26.44 bln
+867.982 mln
3.39%
jan 1, 1967
27.977 bln
+1.537 bln
5.81%
jan 1, 1968
30.094 bln
+2.117 bln
7.57%
jan 1, 1969
31.512 bln
+1.419 bln
4.71%
jan 1, 1970
33.655 bln
+2.143 bln
6.8%
jan 1, 1971
35.973 bln
+2.317 bln
6.89%
jan 1, 1972
38.16 bln
+2.187 bln
6.08%
jan 1, 1973
40.052 bln
+1.892 bln
4.96%
jan 1, 1974
41.325 bln
+1.273 bln
3.18%
jan 1, 1975
42.692 bln
+1.367 bln
3.31%
jan 1, 1976
42.827 bln
+135.311 mln
0.32%
jan 1, 1977
44.804 bln
+1.977 bln
4.62%
jan 1, 1978
46.134 bln
+1.33 bln
2.97%
jan 1, 1979
49.013 bln
+2.879 bln
6.24%
jan 1, 1980
52.02 bln
+3.007 bln
6.14%
jan 1, 1981
54.175 bln
+2.155 bln
4.14%
jan 1, 1982
54.897 bln
+721.807 mln
1.33%
jan 1, 1983
56.63 bln
+1.733 bln
3.16%
jan 1, 1984
56.689 bln
+58.987 mln
0.1%
jan 1, 1985
55.809 bln
-880.083 mln
-1.55%
jan 1, 1986
57.425 bln
+1.616 bln
2.9%
jan 1, 1987
57.911 bln
+486.533 mln
0.85%
jan 1, 1988
59.257 bln
+1.346 bln
2.32%
jan 1, 1989
59.338 bln
+81.276 mln
0.14%
jan 1, 1990
58.794 bln
-543.945 mln
-0.92%
jan 1, 1991
58.38 bln
-414.037 mln
-0.7%
jan 1, 1992
58.894 bln
+514.082 mln
0.88%
jan 1, 1993
59.398 bln
+503.643 mln
0.86%
jan 1, 1994
61.908 bln
+2.51 bln
4.23%
jan 1, 1995
63.248 bln
+1.34 bln
2.16%
jan 1, 1996
64.77 bln
+1.522 bln
2.41%
jan 1, 1997
66.745 bln
+1.975 bln
3.05%
jan 1, 1998
67.086 bln
+340.321 mln
0.51%
jan 1, 1999
69.157 bln
+2.071 bln
3.09%
jan 1, 2000
71.419 bln
+2.262 bln
3.27%
jan 1, 2001
73.513 bln
+2.094 bln
2.93%
jan 1, 2002
74.912 bln
+1.399 bln
1.9%
jan 1, 2003
76.508 bln
+1.596 bln
2.13%
jan 1, 2004
76.694 bln
+185.63 mln
0.24%
jan 1, 2005
77.863 bln
+1.169 bln
1.52%
jan 1, 2006
78.802 bln
+938.995 mln
1.21%
jan 1, 2007
80.803 bln
+2.001 bln
2.54%
jan 1, 2008
81.773 bln
+969.933 mln
1.2%
jan 1, 2009
84.43 bln
+2.657 bln
3.25%
jan 1, 2010
87.003 bln
+2.572 bln
3.05%
jan 1, 2011
88.116 bln
+1.114 bln
1.28%
jan 1, 2012
86.871 bln
-1.245 bln
-1.41%
jan 1, 2013
86.868 bln
-3.023 mln
0.0%
jan 1, 2014
86.285 bln
-583.204 mln
-0.67%
jan 1, 2015
86.463 bln
+178.162 mln
0.21%
jan 1, 2016
85.851 bln
-612.365 mln
-0.71%
Ranking of countries by current statistics by years


Comments: