29
/
en
AIzaSyAYiBZKx7MnpbEhh9jyipgxe19OcubqV5w
April 1, 2024
26523
Early-demographic dividend
EAR
false
2
1
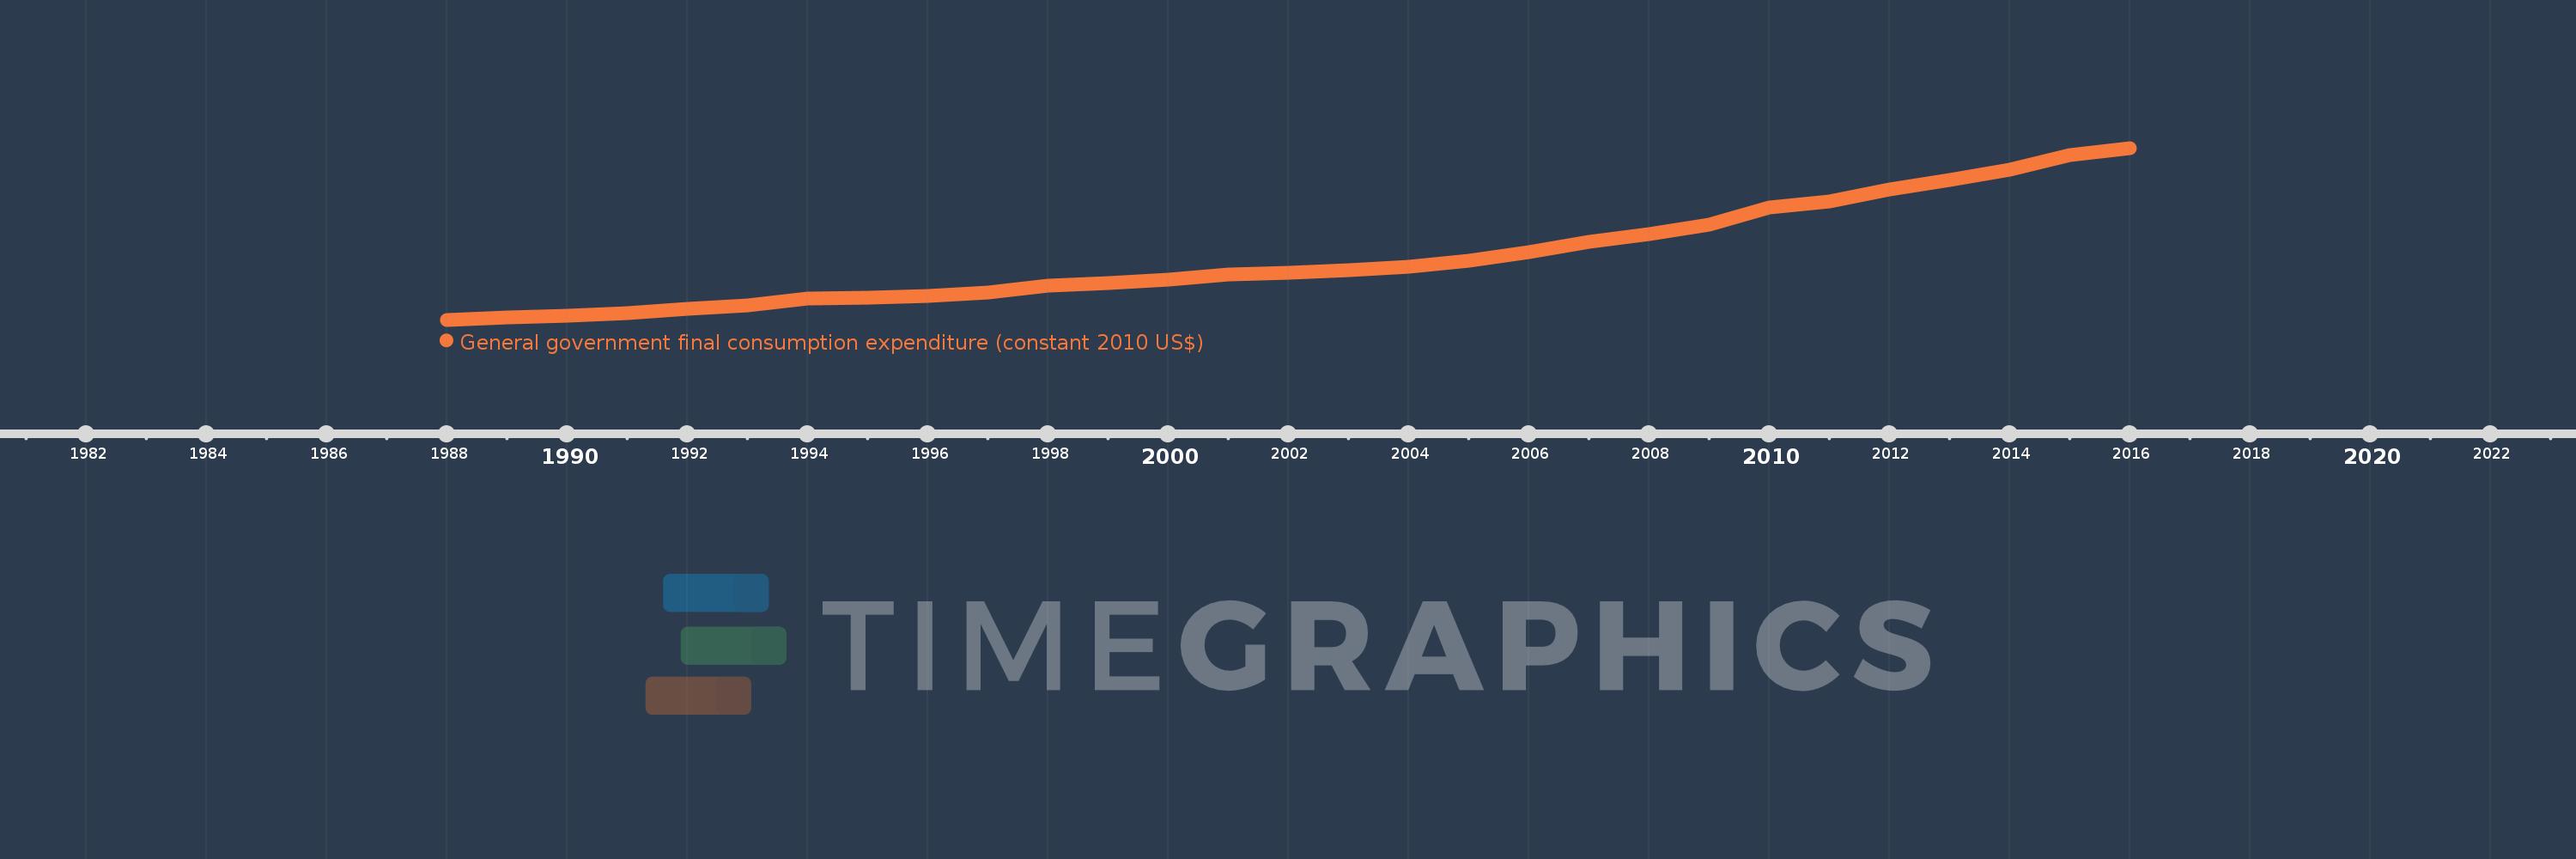
General government final consumption expenditure (constant 2010 US$)
2016,2015,2014,2013,2012,2011,2010,2009,2008,2007,2006,2005,2004,2003,2002,2001,2000,1999,1998,1997,1996,1995,1994,1993,1992,1991,1990,1989,1988
This statistics in other country:
AfghanistanAlbaniaAlgeriaAngolaAntigua and BarbudaArab WorldArgentinaArmeniaArubaAustraliaAustriaAzerbaijanBahamas, TheBahrainBangladeshBarbadosBelarusBelgiumBelizeBeninBermudaBhutanBoliviaBosnia and HerzegovinaBotswanaBrazilBrunei DarussalamBulgariaBurkina FasoBurundiCabo VerdeCambodiaCameroonCanadaCaribbean small statesCentral African RepublicCentral Europe and the BalticsChadChileChinaColombiaComorosCongo, Dem. Rep.Congo, Rep.Costa RicaCote d'IvoireCroatiaCubaCyprusCzech RepublicDenmarkDominicaDominican RepublicEarly-demographic dividendEast Asia & PacificEast Asia & Pacific (excluding high income)East Asia & Pacific (IDA & IBRD countries)EcuadorEgypt, Arab Rep.El SalvadorEquatorial GuineaEritreaEstoniaEuro areaEurope & Central AsiaEurope & Central Asia (excluding high income)Europe & Central Asia (IDA & IBRD countries)European UnionFaroe IslandsFinlandFragile and conflict affected situationsFranceGabonGambia, TheGeorgiaGermanyGhanaGreeceGrenadaGuatemalaGuineaGuinea-BissauGuyanaHaitiHeavily indebted poor countries (HIPC)High incomeHondurasHong Kong SAR, ChinaHungaryIBRD onlyIcelandIDA & IBRD totalIDA blendIDA onlyIDA totalIndiaIndonesiaIran, Islamic Rep.IraqIrelandIsraelItalyJamaicaJapanJordanKazakhstanKenyaKorea, Rep.KosovoKuwaitKyrgyz RepublicLao PDRLate-demographic dividendLatin America & Caribbean Latin America & Caribbean (excluding high income)Latin America & the Caribbean (IDA & IBRD countries)LatviaLeast developed countries: UN classificationLebanonLiberiaLithuaniaLow & middle incomeLow incomeLower middle incomeLuxembourgMacao SAR, ChinaMacedonia, FYRMadagascarMalawiMalaysiaMaliMaltaMauritaniaMauritiusMexicoMiddle East & North AfricaMiddle East & North Africa (excluding high income)Middle East & North Africa (IDA & IBRD countries)Middle incomeMoldovaMongoliaMontenegroMoroccoMozambiqueNamibiaNepalNetherlandsNew ZealandNicaraguaNigerNigeriaNorth AmericaNorwayOECD membersOmanOther small statesPakistanPanamaParaguayPeruPhilippinesPolandPortugalPost-demographic dividendPre-demographic dividendPuerto RicoQatarRomaniaRussian FederationRwandaSaudi ArabiaSenegalSerbiaSeychellesSierra LeoneSingaporeSlovak RepublicSloveniaSmall statesSouth AfricaSouth AsiaSouth Asia (IDA & IBRD)South SudanSpainSri LankaSt. Kitts and NevisSt. LuciaSt. Vincent and the GrenadinesSub-Saharan Africa Sub-Saharan Africa (excluding high income)Sub-Saharan Africa (IDA & IBRD countries)SudanSurinameSwazilandSwedenSwitzerlandTajikistanTanzaniaThailandTimor-LesteTogoTongaTrinidad and TobagoTunisiaTurkeyTurkmenistanUgandaUkraineUnited Arab EmiratesUnited KingdomUnited StatesUpper middle incomeUruguayUzbekistanVanuatuVenezuela, RBVietnamWest Bank and GazaWorldYemen, Rep.ZambiaZimbabwe Timeline:
This timeline shows a graph from 1988 to 2016 of Early-demographic dividend. No data until 1987. Number of actual observations by date: 29.
Source name:
World Development Indicators
Source organization:
World Bank national accounts data, and OECD National Accounts data files.
Categories, topics:
Economy & Growth
Last updated:
apr 23, 2017
Indicators value changes by year
Minimum:
499.833 bln
jan 1, 1988
Maximum:
1.368 trl
jan 1, 2016
At the date of observation
Value
Absolute change
Change from previous value
jan 1, 1988
499.833 bln
+499.833 bln
0.0%
jan 1, 1989
509.737 bln
+9.904 bln
1.98%
jan 1, 1990
520.384 bln
+10.647 bln
2.09%
jan 1, 1991
535.101 bln
+14.716 bln
2.83%
jan 1, 1992
556.514 bln
+21.414 bln
4.0%
jan 1, 1993
570.356 bln
+13.842 bln
2.49%
jan 1, 1994
606.373 bln
+36.017 bln
6.31%
jan 1, 1995
610.512 bln
+4.139 bln
0.68%
jan 1, 1996
621.264 bln
+10.752 bln
1.76%
jan 1, 1997
638.924 bln
+17.661 bln
2.84%
jan 1, 1998
671.067 bln
+32.142 bln
5.03%
jan 1, 1999
687.164 bln
+16.097 bln
2.4%
jan 1, 2000
703.851 bln
+16.688 bln
2.43%
jan 1, 2001
728.144 bln
+24.293 bln
3.45%
jan 1, 2002
736.586 bln
+8.442 bln
1.16%
jan 1, 2003
752.304 bln
+15.717 bln
2.13%
jan 1, 2004
766.881 bln
+14.578 bln
1.94%
jan 1, 2005
799.452 bln
+32.571 bln
4.25%
jan 1, 2006
841.668 bln
+42.216 bln
5.28%
jan 1, 2007
893.228 bln
+51.56 bln
6.13%
jan 1, 2008
931.703 bln
+38.475 bln
4.31%
jan 1, 2009
980.85 bln
+49.147 bln
5.28%
jan 1, 2010
1.067 trl
+85.767 bln
8.74%
jan 1, 2011
1.098 trl
+31.086 bln
2.91%
jan 1, 2012
1.16 trl
+62.081 bln
5.66%
jan 1, 2013
1.206 trl
+46.178 bln
3.98%
jan 1, 2014
1.258 trl
+52.191 bln
4.33%
jan 1, 2015
1.331 trl
+72.596 bln
5.77%
jan 1, 2016
1.368 trl
+36.76 bln
2.76%
Ranking of countries by current statistics by years


Comments: