29
/
en
AIzaSyAYiBZKx7MnpbEhh9jyipgxe19OcubqV5w
April 1, 2024
89814
Botswana
BWA
true
2
1
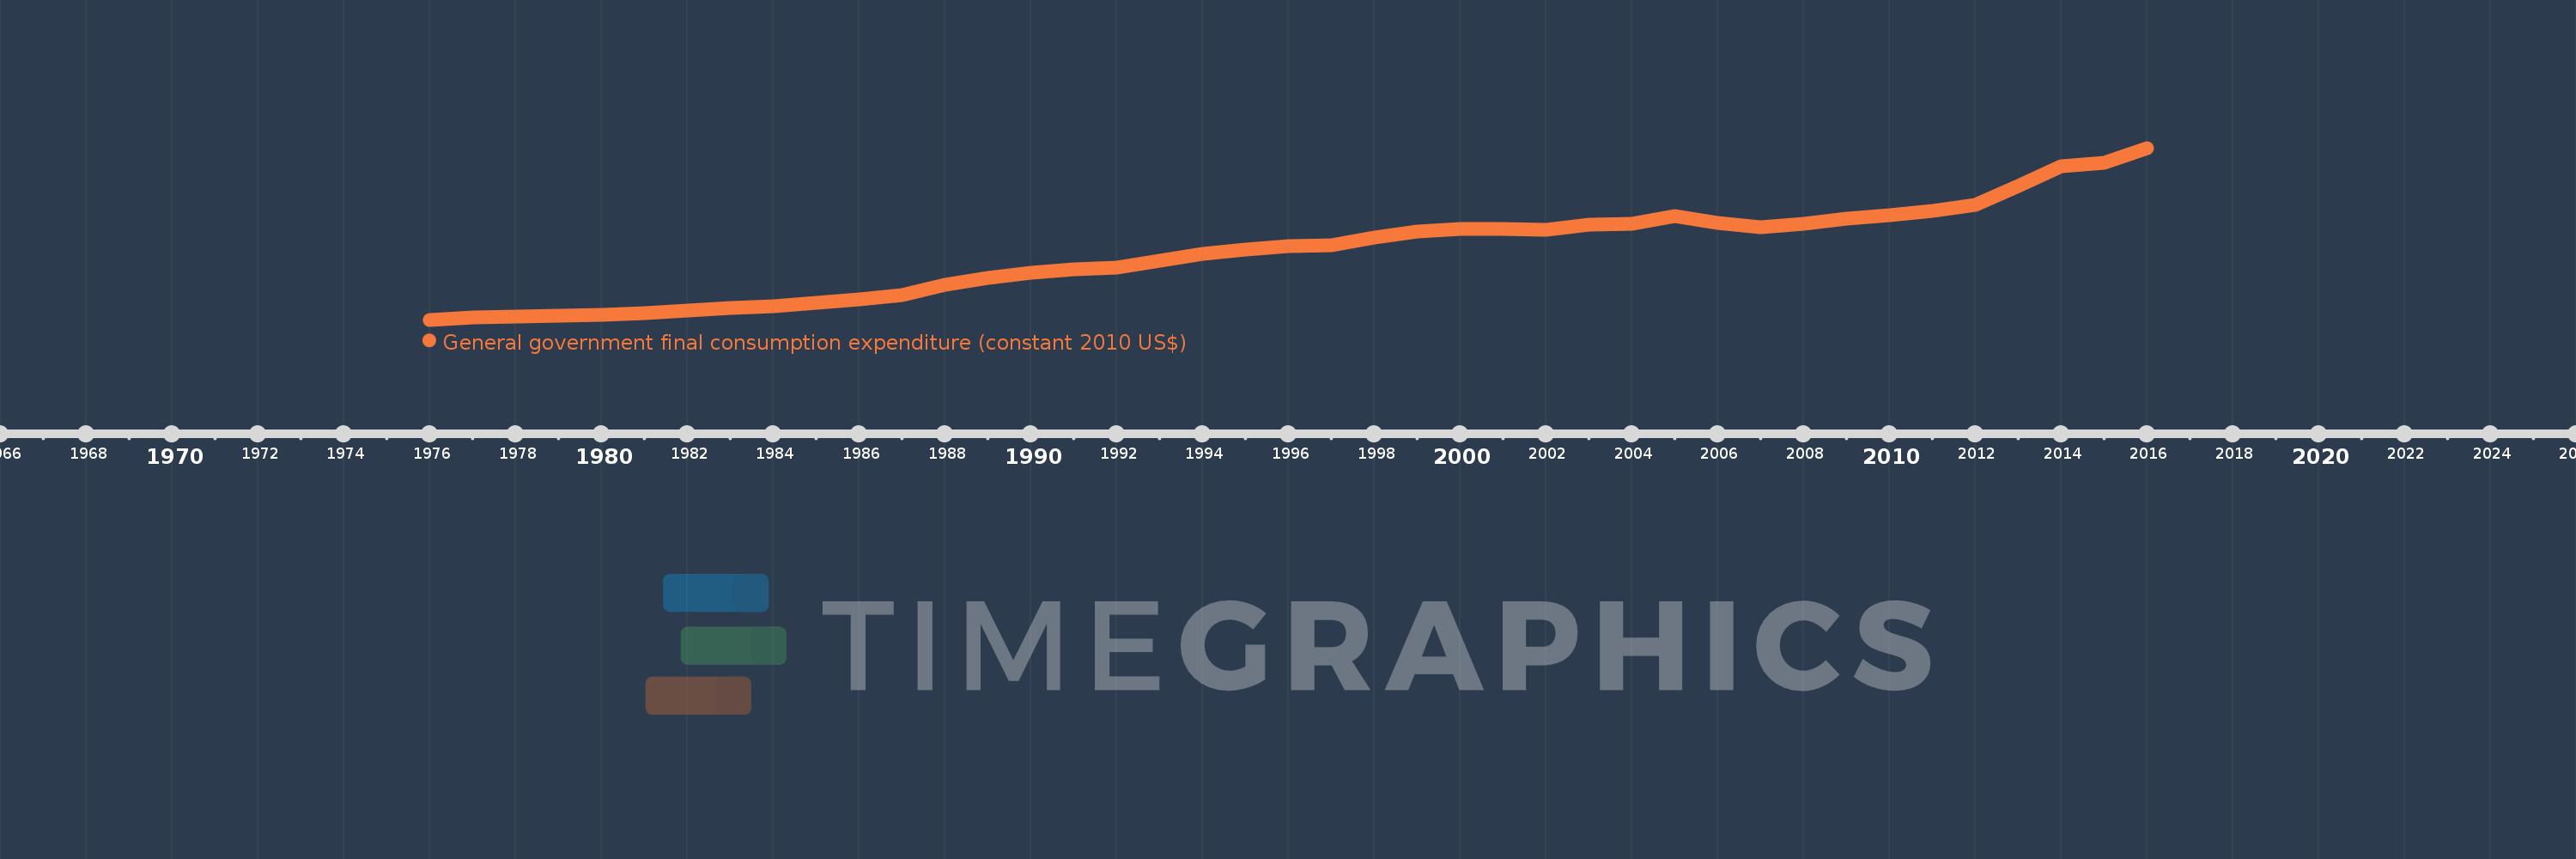
General government final consumption expenditure (constant 2010 US$)
2016,2015,2014,2013,2012,2011,2010,2009,2008,2007,2006,2005,2004,2003,2002,2001,2000,1999,1998,1997,1996,1995,1994,1993,1992,1991,1990,1989,1988,1987,1986,1985,1984,1983,1982,1981,1980,1979,1978,1977,1976
This statistics in other country:
AfghanistanAlbaniaAlgeriaAngolaAntigua and BarbudaArab WorldArgentinaArmeniaArubaAustraliaAustriaAzerbaijanBahamas, TheBahrainBangladeshBarbadosBelarusBelgiumBelizeBeninBermudaBhutanBoliviaBosnia and HerzegovinaBotswanaBrazilBrunei DarussalamBulgariaBurkina FasoBurundiCabo VerdeCambodiaCameroonCanadaCaribbean small statesCentral African RepublicCentral Europe and the BalticsChadChileChinaColombiaComorosCongo, Dem. Rep.Congo, Rep.Costa RicaCote d'IvoireCroatiaCubaCyprusCzech RepublicDenmarkDominicaDominican RepublicEarly-demographic dividendEast Asia & PacificEast Asia & Pacific (excluding high income)East Asia & Pacific (IDA & IBRD countries)EcuadorEgypt, Arab Rep.El SalvadorEquatorial GuineaEritreaEstoniaEuro areaEurope & Central AsiaEurope & Central Asia (excluding high income)Europe & Central Asia (IDA & IBRD countries)European UnionFaroe IslandsFinlandFragile and conflict affected situationsFranceGabonGambia, TheGeorgiaGermanyGhanaGreeceGrenadaGuatemalaGuineaGuinea-BissauGuyanaHaitiHeavily indebted poor countries (HIPC)High incomeHondurasHong Kong SAR, ChinaHungaryIBRD onlyIcelandIDA & IBRD totalIDA blendIDA onlyIDA totalIndiaIndonesiaIran, Islamic Rep.IraqIrelandIsraelItalyJamaicaJapanJordanKazakhstanKenyaKorea, Rep.KosovoKuwaitKyrgyz RepublicLao PDRLate-demographic dividendLatin America & Caribbean Latin America & Caribbean (excluding high income)Latin America & the Caribbean (IDA & IBRD countries)LatviaLeast developed countries: UN classificationLebanonLiberiaLithuaniaLow & middle incomeLow incomeLower middle incomeLuxembourgMacao SAR, ChinaMacedonia, FYRMadagascarMalawiMalaysiaMaliMaltaMauritaniaMauritiusMexicoMiddle East & North AfricaMiddle East & North Africa (excluding high income)Middle East & North Africa (IDA & IBRD countries)Middle incomeMoldovaMongoliaMontenegroMoroccoMozambiqueNamibiaNepalNetherlandsNew ZealandNicaraguaNigerNigeriaNorth AmericaNorwayOECD membersOmanOther small statesPakistanPanamaParaguayPeruPhilippinesPolandPortugalPost-demographic dividendPre-demographic dividendPuerto RicoQatarRomaniaRussian FederationRwandaSaudi ArabiaSenegalSerbiaSeychellesSierra LeoneSingaporeSlovak RepublicSloveniaSmall statesSouth AfricaSouth AsiaSouth Asia (IDA & IBRD)South SudanSpainSri LankaSt. Kitts and NevisSt. LuciaSt. Vincent and the GrenadinesSub-Saharan Africa Sub-Saharan Africa (excluding high income)Sub-Saharan Africa (IDA & IBRD countries)SudanSurinameSwazilandSwedenSwitzerlandTajikistanTanzaniaThailandTimor-LesteTogoTongaTrinidad and TobagoTunisiaTurkeyTurkmenistanUgandaUkraineUnited Arab EmiratesUnited KingdomUnited StatesUpper middle incomeUruguayUzbekistanVanuatuVenezuela, RBVietnamWest Bank and GazaWorldYemen, Rep.ZambiaZimbabwe Timeline:
This timeline shows a graph from 1976 to 2016 of Botswana. No data until 1975. Number of actual observations by date: 41.
Source name:
World Development Indicators
Source organization:
World Bank national accounts data, and OECD National Accounts data files.
Categories, topics:
Economy & Growth
Last updated:
apr 23, 2017
Indicators value changes by year
Minimum:
199.923 mln
jan 1, 1976
Maximum:
3.879 bln
jan 1, 2016
At the date of observation
Value
Absolute change
Change from previous value
jan 1, 1976
199.923 mln
+199.923 mln
0.0%
jan 1, 1977
240.827 mln
+40.904 mln
20.46%
jan 1, 1978
273.314 mln
+32.487 mln
13.49%
jan 1, 1979
279.069 mln
+5.755 mln
2.11%
jan 1, 1980
297.653 mln
+18.583 mln
6.66%
jan 1, 1981
347.674 mln
+50.021 mln
16.81%
jan 1, 1982
396.754 mln
+49.08 mln
14.12%
jan 1, 1983
443.494 mln
+46.74 mln
11.78%
jan 1, 1984
492.95 mln
+49.456 mln
11.15%
jan 1, 1985
562.307 mln
+69.357 mln
14.07%
jan 1, 1986
632.095 mln
+69.788 mln
12.41%
jan 1, 1987
730.631 mln
+98.536 mln
15.59%
jan 1, 1988
939.698 mln
+209.067 mln
28.61%
jan 1, 1989
1.102 bln
+162.757 mln
17.32%
jan 1, 1990
1.2 bln
+97.057 mln
8.8%
jan 1, 1991
1.285 bln
+85.743 mln
7.15%
jan 1, 1992
1.324 bln
+39.073 mln
3.04%
jan 1, 1993
1.469 bln
+144.897 mln
10.94%
jan 1, 1994
1.615 bln
+145.798 mln
9.92%
jan 1, 1995
1.696 bln
+81.331 mln
5.04%
jan 1, 1996
1.768 bln
+71.464 mln
4.21%
jan 1, 1997
1.789 bln
+20.875 mln
1.18%
jan 1, 1998
1.966 bln
+177.309 mln
9.91%
jan 1, 1999
2.096 bln
+130.329 mln
6.63%
jan 1, 2000
2.138 bln
+41.534 mln
1.98%
jan 1, 2001
2.151 bln
+13.182 mln
0.62%
jan 1, 2002
2.12 bln
-31.01 mln
-1.44%
jan 1, 2003
2.23 bln
+110.275 mln
5.2%
jan 1, 2004
2.258 bln
+27.21 mln
1.22%
jan 1, 2005
2.419 bln
+161.714 mln
7.16%
jan 1, 2006
2.266 bln
-152.944 mln
-6.32%
jan 1, 2007
2.176 bln
-90.06 mln
-3.97%
jan 1, 2008
2.253 bln
+76.626 mln
3.52%
jan 1, 2009
2.365 bln
+112.328 mln
4.99%
jan 1, 2010
2.435 bln
+70.081 mln
2.96%
jan 1, 2011
2.526 bln
+90.927 mln
3.73%
jan 1, 2012
2.652 bln
+126.006 mln
4.99%
jan 1, 2013
3.056 bln
+403.933 mln
15.23%
jan 1, 2014
3.491 bln
+435.05 mln
14.24%
jan 1, 2015
3.567 bln
+76.013 mln
2.18%
jan 1, 2016
3.879 bln
+311.667 mln
8.74%
Ranking of countries by current statistics by years


Comments: